Data Interpretation - Bar Charts
Exercise : Bar Charts - Bar Chart 15
- Bar Charts - Bar Chart 1
- Bar Charts - Bar Chart 10
- Bar Charts - Bar Chart 9
- Bar Charts - Bar Chart 8
- Bar Charts - Bar Chart 7
- Bar Charts - Bar Chart 6
- Bar Charts - Bar Chart 5
- Bar Charts - Bar Chart 4
- Bar Charts - Bar Chart 3
- Bar Charts - Bar Chart 2
- Bar Charts - Bar Chart 11
- Bar Charts - Bar Chart 12
- Bar Charts - Bar Chart 13
- Bar Charts - Bar Chart 14
- Bar Charts - Bar Chart 15
- Bar Charts - Bar Chart 16
- Bar Charts - Bar Chart 17
- Bar Charts - Bar Chart 18
- Bar Charts - Bar Chart 19
Directions to Solve
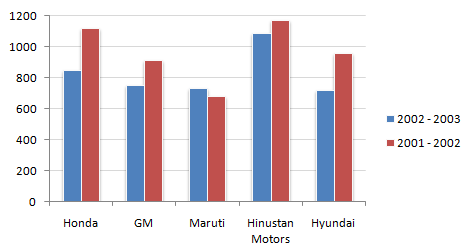
Study the following bar chart and answer the questions carefully.
Sales Turnover of 5 Companies (in Rs. crores)
1.
What is the percentage change in the overall sales turnover of the five companies together between 2001 - 2002 and 2002 - 2003 ?
Answer: Option
Explanation:
The required answer is
100 - percentage value of the fraction (Absolute change/first year's value).
2.
What is the absolute change in overall sales turnover of the five companies together between 2001 - 2002 and 2002 - 2003 ?
Answer: Option
Explanation:
Absolute value of the difference between the sum of the turnover of the five companies for 2001 - 2002 and 2002 - 2003.
3.
Which of the companies shows the maximum percentage difference in sales turnover between the two years ?
Answer: Option
Explanation:
Hyundai with 25.25 % is marginally higher than Honda with 24.5 %.
4.
What should have been the sales turnover of GM in 2002 - 2003 to have shown an excess of the same quantum over 2001 - 2002 as shown by the sales turnover of Maruti ?
Answer: Option
Explanation:
GM should have increased its sales turnover by Rs.49.13 crore. Hence, the answer is 913.63 + 49.13 = 962.76.
5.
What is the approximate difference between the average sales turnover of all the companies put together between the years 2001 - 2002 and 2002 - 2003 ?
Answer: Option
Explanation:
Difference between the sum of the two years divided by 5.
Quick links
Quantitative Aptitude
Verbal (English)
Reasoning
Programming
Interview
Placement Papers