Data Interpretation - Bar Charts
- Bar Charts - Bar Chart 1
- Bar Charts - Bar Chart 10
- Bar Charts - Bar Chart 9
- Bar Charts - Bar Chart 8
- Bar Charts - Bar Chart 7
- Bar Charts - Bar Chart 6
- Bar Charts - Bar Chart 5
- Bar Charts - Bar Chart 4
- Bar Charts - Bar Chart 3
- Bar Charts - Bar Chart 2
- Bar Charts - Bar Chart 11
- Bar Charts - Bar Chart 12
- Bar Charts - Bar Chart 13
- Bar Charts - Bar Chart 14
- Bar Charts - Bar Chart 15
- Bar Charts - Bar Chart 16
- Bar Charts - Bar Chart 17
- Bar Charts - Bar Chart 18
- Bar Charts - Bar Chart 19
The following bar graph shows the Income and Expenditures (in million US $) of five companies in the year 2001. The percent profit or loss of a company is given by
| % Profit/Loss = | Income - Expenditure | x 100 |
| Expenditure |
Income and Expenditure (in million US $) of five companies in the year 2001.
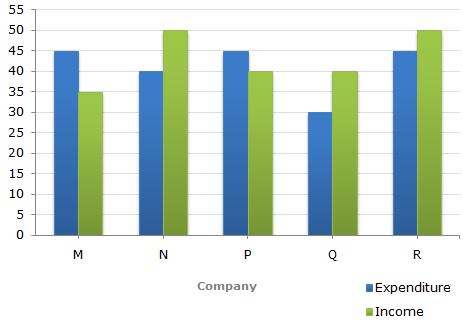
Total income of Companies M and N together
= (35 + 50) million US $
= 85 million US $
Total expenditure of Companies M and N together
= (45 + 40) million US $
= 85 million US $.
 Percent Profit/Loss of companies M and N together
| % Profit/Loss = |  |
85 - 85 | x 100 |  |
= 0%. |
| 85 |
Thus, there was neither loss nor profit for companies M and N together.
Total income of all five companies
= (35 + 50 + 40 + 40 + 50) million US $
= 215 million US $.
Total expenditure of all five companies
= (45 + 40 + 45 + 30 + 45) million US $
= 205 million US $.
| % Profit = |
 |
(215 - 205) | x 100 | ![]](/_files/images/data-interpretation/common/15-sym-cbracket-h1.gif) |
% = 4.88%  5%. 5%. |
| 205 |
The percentage profit/loss in the year 2001 for various comapanies are:
| For M = | |
(35 - 45) | x 100 | |
% = -22.22% i.e., Loss = 22.22%. |
| 45 |
| For N = | |
(50 - 40) | x 100 | |
% = 25% i.e., Profit = 25%. |
| 40 |
| For P = | |
(40 - 45) | x 100 | |
% = -11.11% i.e., Loss = 11.11%. |
| 45 |
| For Q = | |
(40 - 30) | x 100 | |
% = 33.33% i.e., Profit = 33.33%. |
| 30 |
| For R = | |
(50 - 45) | x 100 | |
% = 11.11% i.e., Profit = 11.11%. |
| 45 |
Clearly, the Company Q earned the maximum profit in 2001.
Let the expenditure of Company R in 2000 be x million US $.
| Then, expenditure of Company R in 2001 = | |
120 | x x | |
million US $. |
| 100 |
| |
120x | = 45  x = 37.5. x = 37.5. |
| 100 |
i.e., expenditure of Company R in 2000 = 37.5 million US $.
Let the income of Company R in 2000 be I million US $.
| Then, 10 = | (I - 37.5) | x 100 | [  %Profit in 2000 = 10%] %Profit in 2000 = 10%] |
| 37.5 |
I - 37.5 = 3.75
I = 41.25
i.e., Income of Company R in 2000 = 41.25 million US $.
Let the income of Company Q in 2001 = x million US $.
| Then, income of Company in 2001 = | |
110 | x x | |
million US $. |
| 100 |
| |
110x | = 40 x = |
|
400 | |
. |
| 100 | 11 |
| i.e., income of Company Q in 2000 = | |
400 | |
million US $. |
| 11 |
Let the expenditure of Company Q in 2000 be E million US $.
| Then, 20 = | [(400/11) - E] | x 100 | [ %Profit = 20% ] |
| E |
| 20 = |
|
|
400 | |
- 1 | |
x 100 |
| 11E |
| E = |
400 | x | 100 | = 30.30. |
| 11 | 120 |
Expenditure of Company Q in 2000 = 30.30 million US $.