Data Interpretation - Bar Charts
- Bar Charts - Bar Chart 1
- Bar Charts - Bar Chart 10
- Bar Charts - Bar Chart 9
- Bar Charts - Bar Chart 8
- Bar Charts - Bar Chart 7
- Bar Charts - Bar Chart 6
- Bar Charts - Bar Chart 5
- Bar Charts - Bar Chart 4
- Bar Charts - Bar Chart 3
- Bar Charts - Bar Chart 2
- Bar Charts - Bar Chart 11
- Bar Charts - Bar Chart 12
- Bar Charts - Bar Chart 13
- Bar Charts - Bar Chart 14
- Bar Charts - Bar Chart 15
- Bar Charts - Bar Chart 16
- Bar Charts - Bar Chart 17
- Bar Charts - Bar Chart 18
- Bar Charts - Bar Chart 19
Out of the two bar graphs provided below, one shows the amounts (in Lakh Rs.) invested by a Company in purchasing raw materials over the years and the other shows the values (in Lakh Rs.) of finished goods sold by the Company over the years.
Amount invested in Raw Materials (Rs. in Lakhs)
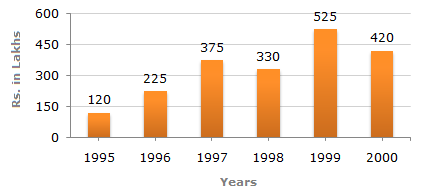
Value of Sales of Finished Goods (Rs. in Lakhs)
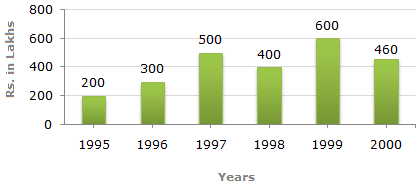
The differences between the amount invested in raw material and the value of sales of finished goods for various years are:
For 1995 = Rs. (200 - 120) lakhs = Rs. 80 lakhs.
For 1996 = Rs. (300 - 225) lakhs = Rs. 75 lakhs.
For 1997 = Rs. (500 - 375) lakhs = Rs. 125 lakhs.
For 1998 = Rs. (400 - 330) lakhs = Rs. 70 lakhs.
For 1999 = Rs. (600 - 525) lakhs = Rs. 75 lakhs.
For 2000 = Rs. (460 - 420) lakhs = Rs. 40 lakhs.
Clearly, maximum difference was during 1997.
| Required percentage |
|
|||||||
| = 48.78% | ||||||||
 49%. 49%. |
Required difference
| = Rs. |  |
1 | x (200 + 300 + 500 + 400 + 600 +460) |
| 6 |
| - | 1 | x (120 + 225 + 375 + 330 + 525 + 420) | ![]](/_files/images/data-interpretation/common/15-sym-cbracket-h1.gif) |
lakhs | |
| 6 |
| = Rs. | |
 |
2460 |  |
- | |
1995 | |
|
lakhs |
| 6 | 6 |
= Rs. (410 - 332.5) lakhs
= Rs. 77.5 lakhs.
The percentage change in the amount invested in raw-materials and in the value of sales of finished goods for different years are:
Percentage change in Amount invested in raw-material:
| For 1996 = | |
(225 - 120) | x 100 | |
% = 87.5%. |
| 120 |
| For 1997 = | |
(375 - 225) | x 100 | |
% = 66.67%. |
| 225 |
| For 1998 = | |
(330 - 375) | x 100 | |
% = -12%. |
| 375 |
| For 1999 = | |
(525 - 330) | x 100 | |
% = 59.09%. |
| 330 |
| For 2000 = | |
(420 - 525) | x 100 | |
% = -20%. |
| 525 |
Percentage change in value of sales of finished goods:
| For 1996 = | |
(300 - 200) | x 100 | |
% = 50%. |
| 200 |
| For 1997 = | |
(500 - 300) | x 100 | |
% = 66.7%. |
| 300 |
| For 1998 = | |
(400 - 500) | x 100 | |
% = -20%. |
| 500 |
| For 1999 = | |
(600 - 400) | x 100 | |
% = 50%. |
| 400 |
| For 2000 = | |
(460 - 600) | x 100 | |
% = -23.33%. |
| 600 |
Thus, the percentage difference is same during the year 1997.
The percentage increase in the amount invested in raw-materials as compared to the previous year, for different years are:
| For 1996 = | |
(225 - 120) | |
% = 87.5%. |
| 120 |
| For 1997 = | |
(375 - 225) | |
% = 66.67%. |
| 225 |
For 1998 there is a decrease.
| For 1999 = | |
(525 - 330) | |
% = 59.09%. |
| 330 |
For 2000 there is a decrease.
 There is maximum percentage increase in 1996.