Data Interpretation - Bar Charts
Exercise : Bar Charts - Bar Chart 11
- Bar Charts - Bar Chart 1
- Bar Charts - Bar Chart 10
- Bar Charts - Bar Chart 9
- Bar Charts - Bar Chart 8
- Bar Charts - Bar Chart 7
- Bar Charts - Bar Chart 6
- Bar Charts - Bar Chart 5
- Bar Charts - Bar Chart 4
- Bar Charts - Bar Chart 3
- Bar Charts - Bar Chart 2
- Bar Charts - Bar Chart 11
- Bar Charts - Bar Chart 12
- Bar Charts - Bar Chart 13
- Bar Charts - Bar Chart 14
- Bar Charts - Bar Chart 15
- Bar Charts - Bar Chart 16
- Bar Charts - Bar Chart 17
- Bar Charts - Bar Chart 18
- Bar Charts - Bar Chart 19
Directions to Solve
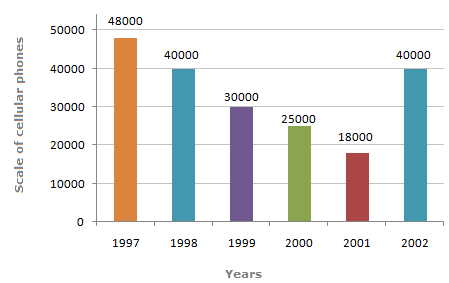
Study the bar chart and answer the questions.
Sale of Cellular Phones
1.
The difference in the sales of cellular phones for the years 1997 and 1999 is ?
Answer: Option
Explanation:
The required answer is got by 48,000 - 30,000 = 18,000.
2.
The two years between which the rate of change of cellular phones is minimum are ?
Answer: Option
Explanation:
The lowest rate of change for
For year 1997 and 1998 = ((48000 - 40000) / 40000) x 100 = 20%
For year 1999 and 2000 = ((30000 - 25000) / 25000) x 100 = 20%
is exhibited by both option (A) and (B).
3.
The sum of sales of cellular phones in the years 1999 and 2001 is equal to that in ?
Answer: Option
Explanation:
The sum of sales in the two years is 30,000 + 18,000 = 48,000, which is the sales value for 1997.
4.
The percentage increases in sales from 2001 to 2002 was ?
Answer: Option
Explanation:
The percentage increase exhibited is
((40 - 18)/18) x 100 = 122 % approximately.
Quick links
Quantitative Aptitude
Verbal (English)
Reasoning
Programming
Interview
Placement Papers