Data Interpretation - Bar Charts
- Bar Charts - Bar Chart 1
- Bar Charts - Bar Chart 10
- Bar Charts - Bar Chart 9
- Bar Charts - Bar Chart 8
- Bar Charts - Bar Chart 7
- Bar Charts - Bar Chart 6
- Bar Charts - Bar Chart 5
- Bar Charts - Bar Chart 4
- Bar Charts - Bar Chart 3
- Bar Charts - Bar Chart 2
- Bar Charts - Bar Chart 11
- Bar Charts - Bar Chart 12
- Bar Charts - Bar Chart 13
- Bar Charts - Bar Chart 14
- Bar Charts - Bar Chart 15
- Bar Charts - Bar Chart 16
- Bar Charts - Bar Chart 17
- Bar Charts - Bar Chart 18
- Bar Charts - Bar Chart 19
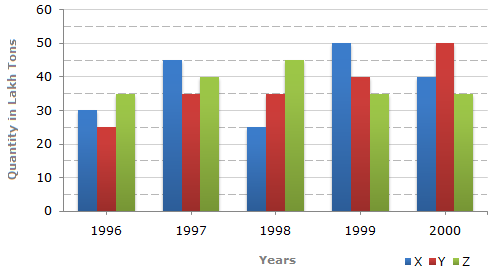
The bar graph given below shows the data of the production of paper (in lakh tonnes) by three different companies X, Y and Z over the years.
Production of Paper (in lakh tonnes) by Three Companies X, Y and Z over the Years.
Percentage change (rise/fall) in the production of Company Y in comparison to the previous year, for different years are:
| For 1997 = |  |
(35 - 25) | x 100 | ![]](/_files/images/data-interpretation/common/15-sym-cbracket-h1.gif) |
% = 40%. |
| 25 |
| For 1998 = | |
(35 - 35) | x 100 | |
% = 0%. |
| 35 |
| For 1999 = | |
(40 - 35) | x 100 | |
% = 14.29%. |
| 35 |
| For 2000 = | |
(50 - 40) | x 100 | |
% = 25%. |
| 40 |
Hence, the maximum percentage rise/fall in the production of Company Y is for 1997.
Average production of Company X in the period 1998-2000
| = | |
1 | x (25 + 50 + 40) | |
= |  |
115 |  |
lakh tons. |
| 3 | 3 |
Average production of Company Y in the period 1998-2000
| = | |
1 | x (35 + 40 + 50) | |
= | |
125 | |
lakh tons. |
| 3 | 3 |
 Required ratio = Required ratio = |
|
= | 115 | = | 23 | . | ||||
|
125 | 25 |
Average production (in lakh tons) in five years for the three companies are:
| For Company X = | |
1 | x (30 + 45 + 25 + 50 + 40) | |
= | 190 | = 38. |
| 5 | 5 |
| For Company Y = | |
1 | x (25 + 35 + 35 + 40 + 50) | |
= | 185 | = 37. |
| 5 | 5 |
| For Company Z = | |
1 | x (35 + 40 + 45 + 35 + 35) | |
= | 190 | = 38. |
| 5 | 5 |
Average production of five years is maximum for both the Companies X and Z.
The percentages of production of Company Z to the production of Company Z for various years are:
| For 1996 = | |
35 | x 100 | |
% = 140%. |
| 25 |
| For 1997 = | |
40 | x 100 | |
% = 114.29%. |
| 35 |
| For 1998 = | |
45 | x 100 | |
% = 128.57%. |
| 35 |
| For 1999 = | |
35 | x 100 | |
% = 87.5%. |
| 40 |
| For 2000 = | |
35 | x 100 | |
% = 70%. |
| 50 |
Clearly, this percentage is highest for 1996.
Percentage increase in the production of Company Y from 1996 to 1999
| = | |
(40 - 25) | x 100 | |
% |
| 25 |
| = | |
15 | x 100 | |
% |
| 25 |
= 60%.