Data Interpretation - Bar Charts
- Bar Charts - Bar Chart 1
- Bar Charts - Bar Chart 10
- Bar Charts - Bar Chart 9
- Bar Charts - Bar Chart 8
- Bar Charts - Bar Chart 7
- Bar Charts - Bar Chart 6
- Bar Charts - Bar Chart 5
- Bar Charts - Bar Chart 4
- Bar Charts - Bar Chart 3
- Bar Charts - Bar Chart 2
- Bar Charts - Bar Chart 11
- Bar Charts - Bar Chart 12
- Bar Charts - Bar Chart 13
- Bar Charts - Bar Chart 14
- Bar Charts - Bar Chart 15
- Bar Charts - Bar Chart 16
- Bar Charts - Bar Chart 17
- Bar Charts - Bar Chart 18
- Bar Charts - Bar Chart 19
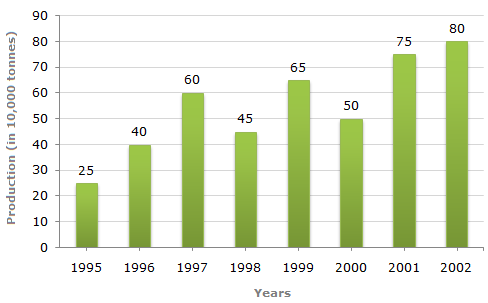
Study the bar chart and answer the question based on it.
Production of Fertilizers by a Company (in 1000 tonnes) Over the Years
| Required percentage = |  |
(45 - 60) | ![]](/_files/images/data-interpretation/common/15-sym-cbracket-h1.gif) |
% = -25%. |
| 60 |
 There is a decline of 25% in production from 1997 to 1998.
| Average production (in 10000 tonnes) of 1996 and 1997 | 40 + 60 | = 50. |
| 2 |
We shall find the average production (in 10000 tonnes) for each of the given alternative pairs:
| 2000 and 2001 = | 50 + 75 | = 62.5. |
| 2 |
| 1999 and 2000 = | 65 + 50 | = 57.5. |
| 2 |
| 1998 and 2000 = | 45 + 50 | = 47.5. |
| 2 |
| 1995 and 1999 = | 25 + 65 | = 45. |
| 2 |
| 1995 and 2001 = | 25 + 75 | = 50. |
| 2 |
The average production of 1996 and 1997 is equal to the average production of 1995 and 2001.
| Required percentage = | |
(80 - 25) | x 100 | |
% = 220%. |
| 25 |
The percentage increase in production compared to previous year for different years are:
| In 1996 = | |
(40 - 25) | x 100 | |
% = 60%. |
| 25 |
| In 1997 = | |
(60 - 40) | x 100 | |
% = 50%. |
| 40 |
In 1998 there is a decrease in production.
| In 1999 = | |
(65 - 45) | x 100 | |
% = 44.44%. |
| 45 |
In 2000 there is a decrease in production.
| In 2001 = | |
(75 - 50) | x 100 | |
% = 50%. |
| 50 |
| In 2002 = | |
(80 - 75) | x 100 | |
% = 6.67%. |
| 75 |
Clearlyl, there is maximum percentage increase in production in 1996.
Average production (in 10000 tonnes) over the given years
| = | 1 | (25 + 40 + 60 + 45 + 65 + 50 + 75 + 80) = 55. |
| 8 |
The productions during the years 1997, 1999, 2001 and 2002 are more than the average production.