Data Interpretation - Bar Charts
Exercise : Bar Charts - Bar Chart 16
- Bar Charts - Bar Chart 1
- Bar Charts - Bar Chart 10
- Bar Charts - Bar Chart 9
- Bar Charts - Bar Chart 8
- Bar Charts - Bar Chart 7
- Bar Charts - Bar Chart 6
- Bar Charts - Bar Chart 5
- Bar Charts - Bar Chart 4
- Bar Charts - Bar Chart 3
- Bar Charts - Bar Chart 2
- Bar Charts - Bar Chart 11
- Bar Charts - Bar Chart 12
- Bar Charts - Bar Chart 13
- Bar Charts - Bar Chart 14
- Bar Charts - Bar Chart 15
- Bar Charts - Bar Chart 16
- Bar Charts - Bar Chart 17
- Bar Charts - Bar Chart 18
- Bar Charts - Bar Chart 19
Directions to Solve
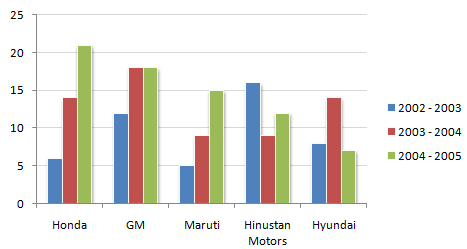
The following chart shows the production of cars in thousands.
Production of Cars for 2002 - 2005 period from the Selected Manufacturers
1.
How many companies have shown production below their average production in 2002 - 2003, but have showed above the average production in 2003 - 2004 ?
Answer: Option
Explanation:
Average sales of company:
Honda = (6 + 14 + 21)/3 = 13.66
GM = (12 + 18 + 18)/3 = 16
Maruti = (5 + 9 + 15)/3 = 9.66
Hindustan Motors= (16 + 9 + 12)/3 = 12.33
Hyundai = (8 + 14 + 7)/3 = 9.66
2.
The ratio of Hindustan Motors production in 2003 - 2004 to Honda's production in 2002 - 2003 is ?
Answer: Option
Explanation:
The required ratio is (9/6) = 1.5.
3.
For how many companies has there been no decrease in production in any year from the previous year ?
Answer: Option
Explanation:
By visual inspection we can say that Honda, GM and Maruti have not shown a decrease.
Quick links
Quantitative Aptitude
Verbal (English)
Reasoning
Programming
Interview
Placement Papers