Data Interpretation - Bar Charts
Exercise : Bar Charts - Bar Chart 19
- Bar Charts - Bar Chart 1
- Bar Charts - Bar Chart 10
- Bar Charts - Bar Chart 9
- Bar Charts - Bar Chart 8
- Bar Charts - Bar Chart 7
- Bar Charts - Bar Chart 6
- Bar Charts - Bar Chart 5
- Bar Charts - Bar Chart 4
- Bar Charts - Bar Chart 3
- Bar Charts - Bar Chart 2
- Bar Charts - Bar Chart 11
- Bar Charts - Bar Chart 12
- Bar Charts - Bar Chart 13
- Bar Charts - Bar Chart 14
- Bar Charts - Bar Chart 15
- Bar Charts - Bar Chart 16
- Bar Charts - Bar Chart 17
- Bar Charts - Bar Chart 18
- Bar Charts - Bar Chart 19
Directions to Solve
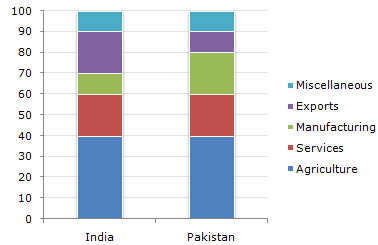
The following bar chart shows the composition of the GDP two countries (India and Pakistan).
Composition of GDP of Two Countries
1.
If the total GDP of Pakistan is Rs. 10,000 crore, then a GDP accounted for by Manufacturing is ?
Answer: Option
Explanation:
20% of 10000 = 2000
2.
What fraction of India's GDP is accounted for by Services ?
Answer: Option
Explanation:
Service accounts for 20%, i.e., (1/5)th of the GDP of India.
3.
If the total GDP of India is Rs.30,000 crores, then the GDP accounted for by Agriculture, Services and Miscellaneous is ?
Answer: Option
Explanation:
(40 + 20 + 10)% of 30,000 = Rs.21,000 crore.
4.
Which country accounts for higher earning out of Services and Miscellaneous together ?
Answer: Option
Explanation:
Although the percentage on Services and Miscellaneous put together is equal for both the countries, we cannot comment on this since we have no data about the respective GDP's.
5.
If the total GDP is the same for both the countries, then what percentage is Pakistan's income through agriculture over India's income through Services ?
Answer: Option
Explanation:
Since the GDP is same, the answer will be got by (40 - 20)/20 = 100%.
Quick links
Quantitative Aptitude
Verbal (English)
Reasoning
Programming
Interview
Placement Papers