Data Interpretation - Bar Charts
- Bar Charts - Bar Chart 1
- Bar Charts - Bar Chart 10
- Bar Charts - Bar Chart 9
- Bar Charts - Bar Chart 8
- Bar Charts - Bar Chart 7
- Bar Charts - Bar Chart 6
- Bar Charts - Bar Chart 5
- Bar Charts - Bar Chart 4
- Bar Charts - Bar Chart 3
- Bar Charts - Bar Chart 2
- Bar Charts - Bar Chart 11
- Bar Charts - Bar Chart 12
- Bar Charts - Bar Chart 13
- Bar Charts - Bar Chart 14
- Bar Charts - Bar Chart 15
- Bar Charts - Bar Chart 16
- Bar Charts - Bar Chart 17
- Bar Charts - Bar Chart 18
- Bar Charts - Bar Chart 19
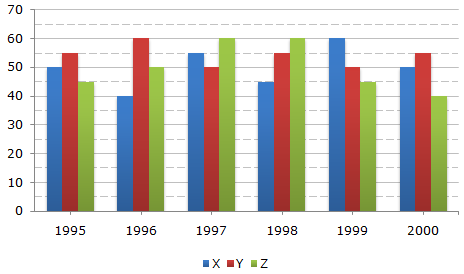
A soft drink company prepares drinks of three different flavours - X, Y and Z. The production of three flavours over a period of six years has been expressed in the bar graph provided below.
Production of Three Different Flavours X, Y and Z by a Company over the years (in lakh bottles)
| Required percentage |
|
|||||||
|
||||||||
| = 133.33%. |
Average annual productions over the given period for various flavours are:
| For Flavour X = |  |
1 | x (50 + 40 + 55 + 45 + 60 + 50) | ![]](/_files/images/data-interpretation/common/15-sym-cbracket-h1.gif) |
= 50 lakh bottles. |
| 6 |
| For Flavour Y = | |
1 | x (55 + 60 + 50 + 55 + 50 + 55) | |
= 54.17 lakh bottles. |
| 6 |
| For Flavour Z = | |
1 | x (45 + 50 + 60 + 60 + 45 + 40) | |
= 50 lakh bottles. |
| 6 |
 Maximum average production is for Flavour Y.
Average production of flavour X in 1995, 1996 and 1997
| = | |
1 | x (50 + 40 + 55) | |
| 3 |
| = |  |
145 |  |
lakh bottles. |
| 3 |
Average production of flavour Y in 1998, 1999 and 2000
| = | |
1 | x (55 + 50 + 55) | |
| 3 |
| = | |
160 | |
lakh bottles. |
| 3 |
| Difference |
|
||||||||
|
|||||||||
| = 5 lakh bottles | |||||||||
| = 5,00,000 bottles. |
Percentage decline in the production of flavour Z in 2000 as compared to the production in 1998
| = | |
(60 - 40) | x 100 | |
% |
| 60 |
| = | |
20 | x 100 | |
% |
| 60 |
= 33.33%
 33%.
33%.
The percentage rise/fall in production from the previous year for flavour Y during various years are:
| In 1996 = | |
(60 - 55) | x 100 | |
% = 9.09% (increase) |
| 55 |
| In 1997 = | |
(60 - 50) | x 100 | |
% = 16.67% (decrease) |
| 60 |
| In 1998 = | |
(55 - 50) | x 100 | |
% = 10% (increase) |
| 55 |
| In 1999 = | |
(55 - 50) | x 100 | |
% = 9.09% (decrease) |
| 55 |
| In 2000 = | |
(55 - 50) | x 100 | |
% = 10% (increase) |
| 50 |
Maximum change is decrease of 16.67% during 1997.