Data Interpretation - Bar Charts
- Bar Charts - Bar Chart 1
- Bar Charts - Bar Chart 10
- Bar Charts - Bar Chart 9
- Bar Charts - Bar Chart 8
- Bar Charts - Bar Chart 7
- Bar Charts - Bar Chart 6
- Bar Charts - Bar Chart 5
- Bar Charts - Bar Chart 4
- Bar Charts - Bar Chart 3
- Bar Charts - Bar Chart 2
- Bar Charts - Bar Chart 11
- Bar Charts - Bar Chart 12
- Bar Charts - Bar Chart 13
- Bar Charts - Bar Chart 14
- Bar Charts - Bar Chart 15
- Bar Charts - Bar Chart 16
- Bar Charts - Bar Chart 17
- Bar Charts - Bar Chart 18
- Bar Charts - Bar Chart 19
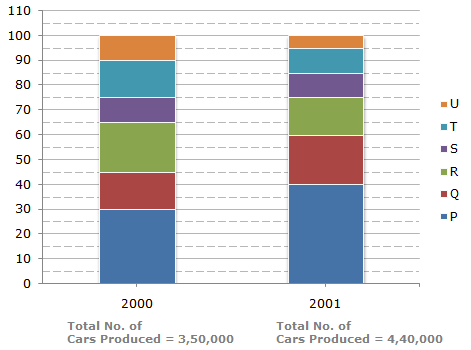
The bar graph given below shows the percentage distribution of the total production of a car manufacturing company into various models over two years.
Percentage of Six different types of Cars manufactured by a Company over Two Years
Total number of Q type cars produced in 2001
=(60 - 40)% of 4,40,000 = 88,000.
Total number of Q type cars produced in 2000
=(45 - 30)% of 3,50,000 = 52,500.
 Required difference = (88000 - 52500) = 35,500.
Analysis of the graph:
We shall first determine the number of cars of each model produced by the Company during the two years:
In 2000 : Total number of cars produced = 3,50,000.
P = (30 - 0)% of 3,50,000 = 30% of 3,50,000 = 1,05,000.
Q = (45 - 30)% of 3,50,000 = 15% of 3,50,000 = 52,500.
R = (65 - 45)% of 3,50,000 = 20% of 3,50,000 = 70,000.
S = (75 - 65)% of 3,50,000 = 10% of 3,50,000 = 35,000.
T = (90 - 75)% of 3,50,000 = 15% of 3,50,000 = 52,500.
U = (100 - 90)% of 3,50,000 = 10% of 3,50,000 = 35,000.
In 2001 : Total number of cars produced = 4,40,000.
P = (40 - 0)% of 4,40,000 = 40% of 4,40,000 = 1,76,000.
Q = (60 - 40)% of 4,40,000 = 20% of 4,40,000 = 88,000.
R = (75 - 60)% of 4,40,000 = 15% of 4,40,000 = 66,000.
S = (85 - 75)% of 4,40,000 = 10% of 4,40,000 = 44,000.
T = (95 - 85)% of 4,40,000 = 10% of 4,40,000 = 44,000.
U = (100 - 95)% of 4,40,000 = 5% of 4,40,000 = 22,000.
Total number of cars of models P, Q and T manufacture in 2000
= (105000 + 52500 + 52500)
= 2,10,000.
If the percentage production of P type cars in 2001
= Percentage production of P type cars in 2000
= 30%.
then, number of P type cars produced in 2001
= 30% of 4,40,000
= 1,32,000.
Number of S type cars which remained unsold in 2000 = 15% of 35,000
and number of S type cars which remained unsold in 2001 = 15% of 44,000.
Total number of S type cars which remained unsold
= 15% of (35,000 + 44,000)
= 15% of 79,000
= 11,850.
The percentage change (rise/fall) in production from 2000 to 2001 for various models is:
| For P = |  |
(176000 - 105000) | x 100 | ![]](/_files/images/data-interpretation/common/15-sym-cbracket-h1.gif) |
% = 67.62%, rise. |
| 105000 |
| For Q = | |
(88000 - 52500) | x 100 | |
% = 67.62%, rise. |
| 52500 |
| For R = | |
(70000 - 66000) | x 100 | |
% = 5.71%, fall. |
| 70000 |
| For S = | |
(44000 - 35000) | x 100 | |
% = 25.71%, rise. |
| 35000 |
| For T = | |
(52500 - 44000) | x 100 | |
% = 16.19%, fall. |
| 52500 |
| For U = | |
(35000 - 22000) | x 100 | |
% = 37.14%, fall. |
| 35000 |
Minimum percentage rise/fall is production is the case of model R.