Data Interpretation - Bar Charts - Discussion
Discussion Forum : Bar Charts - Bar Chart 9 (Q.No. 1)
Directions to Solve
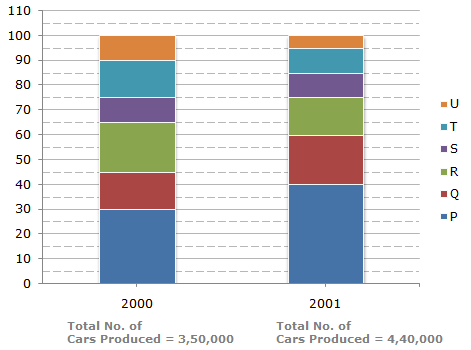
The bar graph given below shows the percentage distribution of the total production of a car manufacturing company into various models over two years.
Percentage of Six different types of Cars manufactured by a Company over Two Years
1.
What was the difference in the number of Q type cars produced in 2000 and that produced in 2001?
Answer: Option
Explanation:
Total number of Q type cars produced in 2001
=(60 - 40)% of 4,40,000 = 88,000.
Total number of Q type cars produced in 2000
=(45 - 30)% of 3,50,000 = 52,500.
 Required difference = (88000 - 52500) = 35,500.
Discussion:
4 comments Page 1 of 1.
Saim don said:
10 months ago
Please explain me the answer in detail.
Divyangi said:
5 years ago
Why (60-40) % is taken? Explain, please.
(4)
Satbir said:
1 decade ago
DId You Mean "Q" Type Cars. ? Itz clear in question that you have to tell the difference Q type cars which are of red color (see on left side the list of 6 cars with colors indication thereof production in both years. !
Ruthra said:
1 decade ago
Why choosen are type cars?
Post your comments here:
Quick links
Quantitative Aptitude
Verbal (English)
Reasoning
Programming
Interview
Placement Papers