Data Interpretation - Bar Charts
Exercise : Bar Charts - Bar Chart 12
- Bar Charts - Bar Chart 1
- Bar Charts - Bar Chart 10
- Bar Charts - Bar Chart 9
- Bar Charts - Bar Chart 8
- Bar Charts - Bar Chart 7
- Bar Charts - Bar Chart 6
- Bar Charts - Bar Chart 5
- Bar Charts - Bar Chart 4
- Bar Charts - Bar Chart 3
- Bar Charts - Bar Chart 2
- Bar Charts - Bar Chart 11
- Bar Charts - Bar Chart 12
- Bar Charts - Bar Chart 13
- Bar Charts - Bar Chart 14
- Bar Charts - Bar Chart 15
- Bar Charts - Bar Chart 16
- Bar Charts - Bar Chart 17
- Bar Charts - Bar Chart 18
- Bar Charts - Bar Chart 19
Directions to Solve
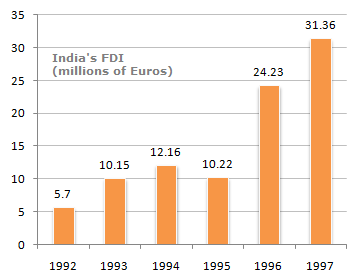
The following bar chart shows the trends of foreign direct investments(FDI) into India from all over the world.
Trends of FDI in India
1.
What was the ratio of investment in 1997 over the investment in 1992 ?
Answer: Option
Explanation:
The 1997 figure of investment as a factor of 1992 investment = (31.36/5.70) = 5.50
2.
What was absolute difference in the FDI to India in between 1996 and 1997 ?
Answer: Option
Explanation:
The difference in investments over 1996-1997 was
31.36 - 24.23 = € 7.13 millions.
3.
If India FDI from OPEC countries was proportionately the same in 1992 and 1997 as the total FDI from all over the world and if the FDI in 1992 from the OPEC countries was Euro 2 million. What was the amount of FDI from the OPEC countries in 1997 ?
Answer: Option
Explanation:
Let x be the FDI in 1997.
Then: (2/5.7) = (x/31.36)
x = (2/5.7) x 31.36
x = 11
4.
Which year exhibited the highest growth in FDI in India over the period shown ?
Answer: Option
Explanation:
It can be seen that the FDI in 1996 more than doubles over that of 1995. No other year is close to that rate of growth.
5.
What was India's total FDI for the period shown in the figure ?
Answer: Option
Explanation:
Total FDI investment in the figure shown is = 5.7 + 10.15 + 12.16 + 10.22 + 24.23 + 31.36 = 93.82 billion.
Quick links
Quantitative Aptitude
Verbal (English)
Reasoning
Programming
Interview
Placement Papers