Data Interpretation - Bar Charts - Discussion
Discussion Forum : Bar Charts - Bar Chart 15 (Q.No. 2)
Directions to Solve
Study the following bar chart and answer the questions carefully.
Sales Turnover of 5 Companies (in Rs. crores)
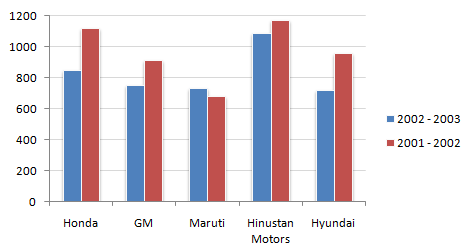
2.
What is the absolute change in overall sales turnover of the five companies together between 2001 - 2002 and 2002 - 2003 ?
Answer: Option
Explanation:
Absolute value of the difference between the sum of the turnover of the five companies for 2001 - 2002 and 2002 - 2003.
Discussion:
16 comments Page 1 of 2.
Paridhi khandelwal said:
2 years ago
I think the right answer is 600 which can be approximated as 683. So, the correct option is C.
(1)
Mamta said:
4 years ago
@Vishal.
From where did you drive all these values? Please explain your answer.
From where did you drive all these values? Please explain your answer.
Vishal Jain said:
5 years ago
I think the right answer is 142.42.
Vishal Jain said:
5 years ago
@All.
It's Data InAdequate ,datas are like for 2002-2003 -847.78,750.31,681.98,1171.01,962.58 And for 2001-2002 are 1122.66,913.63,681.98,1171.01,962.58 now the answer is 142.48.
It's Data InAdequate ,datas are like for 2002-2003 -847.78,750.31,681.98,1171.01,962.58 And for 2001-2002 are 1122.66,913.63,681.98,1171.01,962.58 now the answer is 142.48.
(2)
Subash said:
5 years ago
Why option D is incorrect? Pease explain clearly.
Joseph said:
6 years ago
Yes, Option D is valid. We just estimated some values because the graph is not to giving distinct values.
(2)
Deepu said:
6 years ago
Option D is the right one. We can't take A because too much gap is there 12.43.
Dilip kumar said:
7 years ago
The answer should be 700 not 712.43.
but as we can see the data is not accurate as we are taking like we are taking 800 first value but that is not 800.
but as we can see the data is not accurate as we are taking like we are taking 800 first value but that is not 800.
(1)
Suchilita said:
8 years ago
Absolute change = (sum of all the values of 2001-02) - (sum of all the values of 2002-03).
Nishtha said:
9 years ago
As the difference is 700, hence taking the near most value 712.43.
(3)
Post your comments here:
Quick links
Quantitative Aptitude
Verbal (English)
Reasoning
Programming
Interview
Placement Papers