Online Data Interpretation Test - Data Interpretation Test 5
- This is a FREE online test. Beware of scammers who ask for money to attend this test.
- Total number of questions: 20.
- Time allotted: 30 minutes.
- Each question carries 1 mark; there are no negative marks.
- DO NOT refresh the page.
- All the best!
Marks : 2/20
Test Review : View answers and explanation for this test.
Study the following bar chart and answer the questions carefully.
Sales Turnover of 5 Companies (in Rs. crores)
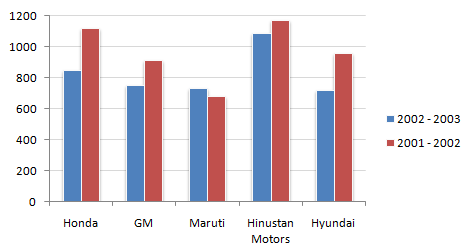
The required answer is
100 - percentage value of the fraction (Absolute change/first year's value).
The circle-graph given here shows the spendings of a country on various sports during a particular year. Study the graph carefully and answer the questions given below it.
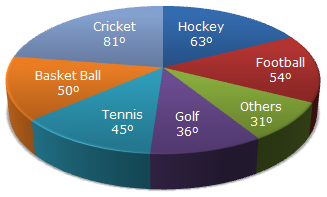
| Percentage of money spend on Tennis = |  |
45 | x 100 |  |
% = 12 | 1 | %. |
| 360 | 2 |
Let the total spendings on sports be Rs. x. Then,
| Amount spent on Golf = Rs. | |
36 | x x | |
= Rs. | x | . |
| 360 | 10 |
| Amount spent on Hockey = Rs | |
63 | x x | |
= Rs. | 7x | . |
| 360 | 40 |
| Difference = Rs. | |
7x | - | x | |
= Rs | 3x | . |
| 40 | 10 | 40 |
 Required percentage = Rs. Required percentage = Rs. |
 |
|
3x/40 | |
x 100 |  |
% = 75%. |
| x/10 |
Let the total spendings on sports be Rs. x. Then,
| Amount spent on Cricket = Rs. | |
81 | x x | |
= Rs. | 9x | . |
| 360 | 40 |
| Amount spent on Football = Rs | |
54 | x x | |
= Rs. | 3x | . |
| 360 | 20 |
| Difference = Rs. | |
9x | - | 3x | |
= Rs | 3x | . |
| 40 | 20 | 40 |
| Required percentage = Rs. |
|
|
3x/40 | |
x 100 | |
% = 33 | 1 | %. |
| 9x/40 | 3 |
| Amount spent on Cricket and Hockey together |
|
|||||||
| = Rs. 0.8 crores | ||||||||
| = Rs. 80,00,000. |
Amount spent on Basketball exceeds that on Tennis by:
| Rs. | |
(50 - 45) | x 1,80,00,000 | |
= Rs. 2,50,000. |
| 360 |
Answer the questions based on the given line graph.
Ratio of Exports to Imports (in terms of money in Rs. crores) of Two Companies Over the Years
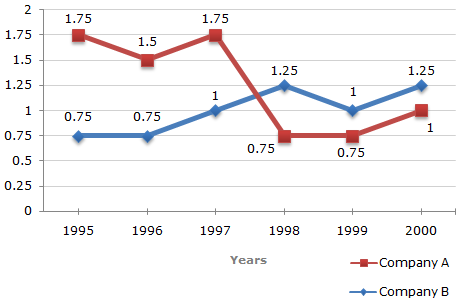
The exports are more than imports in those years for which the exports to imports ratio are more than 1. For Company A, such years are 1995, 1996 and 1997.
Thus, during these 3 years, the exports are more than the imports for Company A.
We shall try to find the difference between the imports and exports of Company B for various years one by one:
For 1995: We have
| E | = 0.75 |
| I |
where E = amount of exports, I = amount of imports in 1995.
 E = 0.75I
I - E = 0.75 x I = 0.25I.
Thus, the difference between the imports and exports of Company B in 1995 is dependent on the amount of imports of Company B in 1995.
Similarly, the difference for other years can be determined only if the amount of imports for these years is known.
Since the imports or exports for various years are not know, the differences between and exports for various years cannot be determined.
Let the amount of imports of Company A in 1998 be Rs. x crores.
| Then, | 237 | = 0.75 x = |
237 | = 316. |
| x | 0.75 |
Amount of imports of Company A in 1998 = Rs. 316 crores.
In 1997 for Company A we have:
| E | = 1.75 i.e., E = 1.75I |
| I |
where E amount of exports, I = amount of imports of Company A in 1997.
Now, the required imports I1 = I + 40% of I = 1.4I.
| Required ratio = |
E | = | 1.75I | = 1.25. |
| I1 | 1.4I |
In 1995 for Company A we have:
| EA | = 1.75 ... (i) |
| IA |
[where EA = amount of exports, IA = amount of imports of Company a in 1995]
In 1995 for Company B we have:
| EB | = 0.75 ... (ii) |
| IB |
[where EB = amount of exports, IB = amount of imports of Company B in 1995]
Also, we have EA = 2EB ... (iii)
Substituting IA = Rs. 180 crores (given) in (i), we get:
EA = Rs. (180 x 1.75) crores = Rs. 315 crores.
Using EA = Rs. 315 crores in (iii), we get:
| EB = | EA | = Rs. | |
315 | |
crores. |
| 2 | 2 |
| Substituting EB = Rs. | |
315 | |
crores in (ii), we get: |
| 2 |
| IB = | EB | = Rs. | |
315 | |
crores = Rs. 210 crores. |
| 0.75 | 2 x 0.75 |
i.e., amount of imports of Company B in 1995 = Rs. 210 crores.
The following table shows the number of new employees added to different categories of employees in a company and also the number of employees from these categories who left the company every year since the foundation of the Company in 1995.
| Year | ||||||||||
| Managers | Technicians | Operators | Accountants | Peons | ||||||
| New | Left | New | Left | New | Left | New | Left | New | Left | |
| 1995 | 760 | - | 1200 | - | 880 | - | 1160 | - | 820 | - |
| 1996 | 280 | 120 | 272 | 120 | 256 | 104 | 200 | 100 | 184 | 96 |
| 1997 | 179 | 92 | 240 | 128 | 240 | 120 | 224 | 104 | 152 | 88 |
| 1998 | 148 | 88 | 236 | 96 | 208 | 100 | 248 | 96 | 196 | 80 |
| 1999 | 160 | 72 | 256 | 100 | 192 | 112 | 272 | 88 | 224 | 120 |
| 2000 | 193 | 96 | 288 | 112 | 248 | 144 | 260 | 92 | 200 | 104 |
Total number of Operators who left the Company during 1995 - 2000
= (104 + 120 + 100 + 112 + 144)
= 580.
Total number of Operators who joined the Company during 1995 - 2000
= (880 + 256 + 240 + 208 + 192 + 248)
= 2024.
| Required Percentage = |
|
580 | x 100 | |
% = 28.66%  29%. 29%. |
| 2024 |
Number of Managers working in the Company:
| In 1995 | = 760. |
| In 2000 | = (760 + 280 + 179 + 148 + 160 + 193) - (120 + 92 + 88 + 72 + 96) |
| = 1252. |
Percentage increase in the number of Managers
| = | |
(1252 - 760) | x 100 | |
% = 64.74%. |
| 760 |
Number of Technicians working in the Company:
| In 1995 | = 1200. |
| In 2000 | = (1200 + 272 + 240 + 236 + 256 + 288) - (120 + 128 + 96 + 100 + 112) |
| = 1936. |
Percentage increase in the number of Technicians
| = | |
(1936 - 1200) | x 100 | |
% = 61.33%. |
| 1200 |
Number of Operators working in the Company:
| In 1995 | = 880. |
| In 2000 | = (880 + 256 + 240 + 208 + 192 + 248) - (104 + 120 + 100 + 112 + 144) |
| = 1444. |
Percentage increase in the number of Operators
| = | |
(1444 - 880) | x 100 | |
% = 64.09%. |
| 880 |
Number of Accountants working in the Company:
| In 1995 | = 1160. |
| In 2000 | = (1160 + 200 + 224 + 248 + 272 + 260) - (100 + 104 + 96 + 88 + 92) |
| = 1884. |
Percentage increase in the number of Accountants
| = | |
(1884 - 1160) | x 100 | |
% = 62.41%. |
| 1160 |
Number of Peons working in the Company:
| In 1995 | = 820. |
| In 2000 | = (820 + 184 + 152 + 196 + 224 + 200) - (96 + 88 + 80 + 120 + 104) |
| = 1288. |
Percentage increase in the number of Peons
| = | |
(1288 - 820) | x 100 | |
% = 57.07%. |
| 820 |
Clearly, the percentage increase is maximum in case of Managers.
Required difference
= (272 + 240 + 236 + 256 + 288) - (200 + 224 + 248 + 272 + 260)
= 88.
Total number of Peons working in the Company in 1999
= (820 + 184 + 152 + 196 + 224) - (96 + 88 + 80 + 120)
= 1192.
Total number of employees of various categories working in the Company in 1997 are:
| Managers | = (760 + 280 + 179) - (120 + 92) = 1007. |
| Technicians | = (1200 + 272 + 240) - (120 + 128) = 1464. |
| Operators | = (880 + 256 + 240) - (104 + 120) = 1152. |
| Accountants | = (1160 + 200 + 224) - (100 + 104) = 1380. |
| Peons | = (820 + 184 + 152) - (96 + 88) = 972. |
Pooled average of all the five categories of employees working in the Company in 1997
| = | 1 | x (1007 + 1464 + 1152 + 1380 + 972) |
| 5 |
| = | 1 | x (5975) |
| 5 |
= 1195.