Data Interpretation - Line Charts - Discussion
Discussion Forum : Line Charts - Line Chart 7 (Q.No. 1)
Directions to Solve
Answer the questions based on the given line graph.
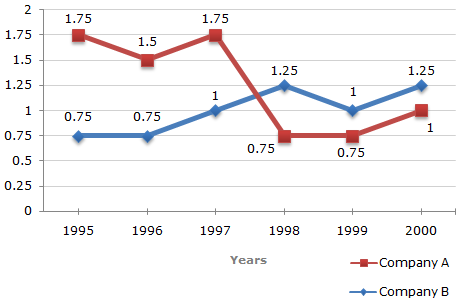
Ratio of Exports to Imports (in terms of money in Rs. crores) of Two Companies Over the Years
1.
In how many of the given years were the exports more than the imports for Company A?
Answer: Option
Explanation:
The exports are more than imports in those years for which the exports to imports ratio are more than 1. For Company A, such years are 1995, 1996 and 1997.
Thus, during these 3 years, the exports are more than the imports for Company A.
Discussion:
6 comments Page 1 of 1.
Mansi Parihar said:
9 years ago
Hi @Srivastava, @Neya.
Export/Import for company A in 1995
Given (export/import) ---- export/Import ---- year
1.75=1.75/1 ---- 175/100 ---- 1995
1.5= 1.5/1 ---- 15/10 ---- 1996
1.75 = 1.75/100 ---- 175/100 ---- 1997
0.75 = 0.75/100 ---- 75/100 ---- 1998
0.75 =0.75/100 ---- 75/100 ---- 1999
1 =1/1 ---- 1/1 ---- 2000
ANS: 1995, 96, 97.
(2)
Neya said:
10 years ago
Same question as Srivastava.
Please give the solution for us.
Please give the solution for us.
(1)
Neya said:
10 years ago
How to find EXPORT and IMPORT ratios in one company?
Andy said:
1 decade ago
I agree with the given answer as in 2000 it is 1 but it is asking about more exports so can not consider equal values.
(1)
Swapnil said:
1 decade ago
I do no agree with this answer. In my opinion the answer has to be 1995, 1997, 2000 as it shows an increase in export.
(1)
Srivastava said:
1 decade ago
Can some one explain me how to distinguish between EXPORT and IMPORT ratio respectively, because as this graph gives information about A and B companies inform.
In clear to ask - how to find EXPORT and IMPORT ratios in one company?
It'd be very great-full and appreciated, if I get response ASAP.
In clear to ask - how to find EXPORT and IMPORT ratios in one company?
It'd be very great-full and appreciated, if I get response ASAP.
(2)
Post your comments here:
Quick links
Quantitative Aptitude
Verbal (English)
Reasoning
Programming
Interview
Placement Papers