Online Data Interpretation Test - Data Interpretation Test 4
- This is a FREE online test. Beware of scammers who ask for money to attend this test.
- Total number of questions: 20.
- Time allotted: 30 minutes.
- Each question carries 1 mark; there are no negative marks.
- DO NOT refresh the page.
- All the best!
Marks : 2/20
Test Review : View answers and explanation for this test.
Study the following graph and the table and answer the questions given below.
Data of different states regarding population of states in the year 1998
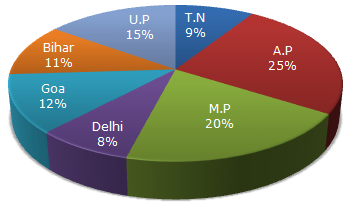
Total population of the given States = 3276000.
| States | Sex and Literacy wise Population Ratio | |||
| Sex | Literacy | |||
| M | F | Literate | Illiterate | |
| A.P | 5 | 3 | 2 | 7 |
| M.P | 3 | 1 | 1 | 4 |
| Delhi | 2 | 3 | 2 | 1 |
| Goa | 3 | 5 | 3 | 2 |
| Bihar | 3 | 4 | 4 | 1 |
| U.P. | 3 | 2 | 7 | 2 |
| T.N. | 3 | 4 | 9 | 4 |
| Number of males in U.P. |
|
|||||||
|
||||||||
| = 294840. |
| No. of illiterate people in A.P. = |  |
7 | of (25% of 3276000) | ![]](/_files/images/data-interpretation/common/15-sym-cbracket-h1.gif) |
= 637000. |
| 9 |
| No. of illiterate people in M.P. = | |
4 | of (20% of 3276000) | |
= 524160. |
| 5 |
 Total number = (637000 + 524160) = 1161160.
| Required ratio |
|
|||||||||||||
|
||||||||||||||
|
||||||||||||||
|
| Number of males in U.P = | |
3 | of (15% of N) | |
= | 3 | x | 15 | x N = 9 x | N | . |
| 5 | 5 | 100 | 100 |
where N = 3276000.
| Number of males in M.P = | |
3 | of (20% of N) | |
= | 3 | x | 20 | x N = 15 x | N | . |
| 4 | 4 | 100 | 100 |
| Number of males in Goa = | |
3 | of (12% of N) | |
= | 3 | x | 12 | x N = 4.5 x | N | . |
| 8 | 8 | 100 | 100 |
| Total number of males in these three states |
|
|||||||
|
| Required Percentage = |
 |
|
x 100 | ![]](/_files/images/data-interpretation/common/15-sym-cbracket-h3.gif) |
% = 28.5%. | |||||
| N |
Let x be the population of U.P. in 1997. Then,
| Population of U.P. in 1998 = 110% of x = | 110 | x x. |
| 100 |
Also, let y be the population of M.P. in 1997. Then,
| Population of M.P. in 1998 = 112% of y = | 112 | x y. |
| 100 |
| Ratio of populations of U.P. and M.P. in 1998 = |
|
= | 110x | . | |||||
|
112y |
| From the pie-chart, this ratio is | 15 | . |
| 20 |
|
110x | = | 15 |  |
x | = | 15 | x | 112 | = | 42 | . |
| 112y | 20 | y | 20 | 110 | 55 |
Thus, ratio of populations of U.P. and M.P. in 1997 = x : y = 42 : 55.
In a school the periodical examination are held every second month. In a session during April 2001 - March 2002, a student of Class IX appeared for each of the periodical exams. The aggregate marks obtained by him in each perodical exam are represented in the line-graph given below.
Marks Obtained by student in Six Periodical Held in Every Two Months During the Year in the Session 2001 - 2002.
Maximum Total Marks in each Periodical Exam = 500
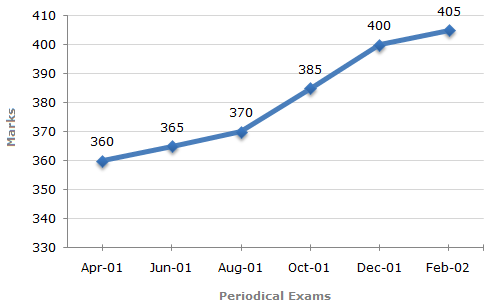
Here it is clear from the graph that the student obtained 360, 365, 370, 385, 400 and 405 marks in periodical exams held in Apr 01, Jun 01, Aug 01, Oct 01, Dec 01 and Feb 02 respectively.
| Required percentage = |  |
405 | x 100 |  |
% = 112.5%. |
| 360 |
Average marks obtained in all the periodical exams
| = | 1 | x [360 + 365 + 370 + 385 + 400 + 405] = 380.83  381. 381. |
| 6 |
| Required percentage = | |
(370 + 385) | x 100 | |
% = | |
755 | x 100 | |
% = 75.5%. |
| (500 + 500) | 1000 |
As is clear from the graph, the total marks obtained in periodical exams, go on increasing. Since, the maximum marks for all the periodical exams are the same; it implies that the percentage of marks also goes on increasing.
Thus, in none of the periodical exams, there is a fall in percentage of marks compared to the previous exam.
Percentage increase in marks in various periodical exams compared to the previous exams are:
| For Jun 01 = | |
(365 - 360) | x 100 | |
% = 1.39%. |
| 360 |
| For Aug 01 = | |
(370 - 365) | x 100 | |
% = 1.37%. |
| 365 |
| For Oct 01 = | |
(385 - 370) | x 100 | |
% = 4.05%. |
| 370 |
| For Dec 01 = | |
(400 - 385) | x 100 | |
% = 3.90%. |
| 385 |
| For Feb 02 = | |
(404 - 400) | x 100 | |
% = 1.25%. |
| 400 |
Clearly, highest percentage increase in marks is in Oct 01.
Study the following table and answer the questions based on it.
Number of Candidates Appeared, Qualified and Selected in a Competitive Examination from Five States Delhi, H.P, U.P, Punjab and Haryana Over the Years 1994 to 1998
| Year | Delhi | H.P | U.P | Punjab | Haryana | ||||||||||
| App | Qual | Sel | App | Qual | Sel | App | Qual | Sel | App | Qual | Sel | App | Qual | Sel | |
| 1997 | 8000 | 850 | 94 | 7800 | 810 | 82 | 7500 | 720 | 78 | 8200 | 680 | 85 | 6400 | 700 | 75 |
| 1998 | 4800 | 500 | 48 | 7500 | 800 | 65 | 5600 | 620 | 85 | 6800 | 600 | 70 | 7100 | 650 | 75 |
| 1999 | 7500 | 640 | 82 | 7400 | 560 | 70 | 4800 | 400 | 48 | 6500 | 525 | 65 | 5200 | 350 | 55 |
| 2000 | 9500 | 850 | 90 | 8800 | 920 | 86 | 7000 | 650 | 70 | 7800 | 720 | 84 | 6400 | 540 | 60 |
| 2001 | 9000 | 800 | 70 | 7200 | 850 | 75 | 8500 | 950 | 80 | 5700 | 485 | 60 | 4500 | 600 | 75 |
The percentages of candidates selected over the candidates appeared in 1997, for various states are:
| (i) For Delhi = | |
94 | x 100 | |
% = 1.175%. |
| 8000 |
| (ii) For H.P. = | |
82 | x 100 | |
% = 1.051%. |
| 7800 |
| (iii) For U.P. = | |
78 | x 100 | |
% = 1.040%. |
| 7500 |
| (iv) For Punjab | |
85 | x 100 | |
% = 1.037%. |
| 8200 |
| (v) For Haryana | |
75 | x 100 | |
% = 1.172%. |
| 6400 |
Clearly, this percentage is lowest for Punjab.
The percentages of candidates qualified from Punjab over those appeared from Punjab during different years are:
| For 1997 = | |
680 | x 100 | |
% = 8.29%. |
| 8200 |
| For 1998 = | |
600 | x 100 | |
% = 8.82%. |
| 6800 |
| For 1999 = | |
525 | x 100 | |
% = 8.08%. |
| 6500 |
| For 2000 = | |
720 | x 100 | |
% = 9.23%. |
| 7800 |
| For 2001 = | |
485 | x 100 | |
% = 8.51%. |
| 5700 |
Clearly, this percentage is highest for the year 2000.
The percentages of candidates selected from U.P. over those qualified from U.P. during different years are:
| For 1997 = | |
78 | x 100 | |
% = 10.83%. |
| 720 |
| For 1998 = | |
85 | x 100 | |
% = 13.71%. |
| 620 |
| For 1999 = | |
48 | x 100 | |
% = 12%. |
| 400 |
| For 2000 = | |
70 | x 100 | |
% = 10.77%. |
| 650 |
| For 2001 = | |
80 | x 100 | |
% = 8.42%. |
| 950 |
Clearly, this percentage is highest for the year 1998.
| Required percentage |
|
|||||||
|
||||||||
| = 88.54% | ||||||||
| 88.5% |
The average number of candidates selected over the given period for various states are:
| For Delhi = | 94 + 48 + 82 + 90 + 70 | = | 384 | = 76.8. |
| 5 | 5 |
| For H.P. = | 82 + 65 + 70 + 86 + 75 | = | 378 | = 75.6. |
| 5 | 5 |
| For U.P. = | 78 + 85 + 48 + 70 + 80 | = | 361 | = 72.2. |
| 5 | 5 |
| For Punjab = | 85 + 70 + 65 + 84 + 60 | = | 364 | = 72.8. |
| 5 | 5 |
| For Haryana = | 75 + 75 + 55 + 60 + 75 | = | 340 | = 68. |
| 5 | 5 |
Clearly, this average is maximum for Delhi.
A cosmetic company provides five different products. The sales of these five products (in lakh number of packs) during 1995 and 2000 are shown in the following bar graph.
Sales (in lakh number of packs) of five different products of Cosmetic Company during 1995 and 2000
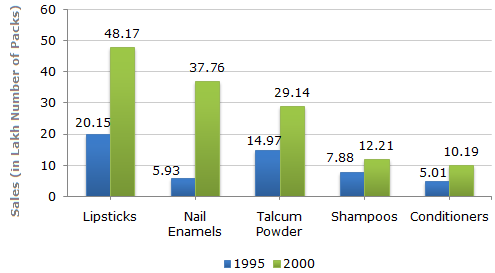
The percentage increase from 1995 to 2000 for various products are:
| Lipsticks = | |
(48.17 - 20.15) | x 100 | |
% = 139.06%. |
| 20.15 |
| Nail enamels = | |
(37.76 - 5.93) | x 100 | |
% = 536.76%. |
| 5.93 |
| Talcum powders = | |
(29.14 - 14.97) | x 100 | |
% = 94.66%. |
| 14.97 |
| Shampoos = | |
(12.21 - 7.88) | x 100 | |
% = 54.95% 55%. |
| 7.88 |
| Conditioners = | |
(10.19 - 5.01) | x 100 | |
% = 103.39%. |
| 5.01 |
The minimum rate of increase in sales from 1995 to 2000 is in the case of Shampoos.
| Required percentage |
|
|||||||
| = 27.57% | ||||||||
| 28%. |
| Required percentage |
|
|||||||
| = 36.42% | ||||||||
| 36%. |
| Required ratio = | 37.76 | 2.5 = |
5 | . |
| 14.97 | 2 |