Data Interpretation - Line Charts - Discussion
In a school the periodical examination are held every second month. In a session during April 2001 - March 2002, a student of Class IX appeared for each of the periodical exams. The aggregate marks obtained by him in each perodical exam are represented in the line-graph given below.
Marks Obtained by student in Six Periodical Held in Every Two Months During the Year in the Session 2001 - 2002.
Maximum Total Marks in each Periodical Exam = 500
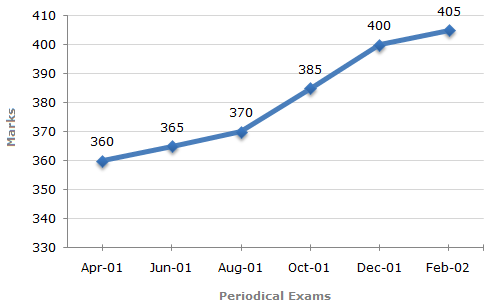
As is clear from the graph, the total marks obtained in periodical exams, go on increasing. Since, the maximum marks for all the periodical exams are the same; it implies that the percentage of marks also goes on increasing.
Thus, in none of the periodical exams, there is a fall in percentage of marks compared to the previous exam.
The question is all about the percent of marks' fall to be COMPARED to previous exams.
Percentage increase in marks in various periodical exams compared to the previous exams are:
For Jun 01 = 1.39%.
For Aug 01 = 1.37%.
For Oct 01 = 4.05%.
For Dec 01 = 3.90%.
For Feb 02 = 1.25%.
So it is very clear that the percentage falls from 4.05 in oct to 3.90 in dec. so dec 01 is the right answer. do not just look at the gradual increase in graph. check the question carefully. it is the usual trap students fall.