Data Interpretation - Pie Charts - Discussion
Discussion Forum : Pie Charts - Pie Chart 12 (Q.No. 3)
Directions to Solve
Study the following graph and the table and answer the questions given below.
Data of different states regarding population of states in the year 1998
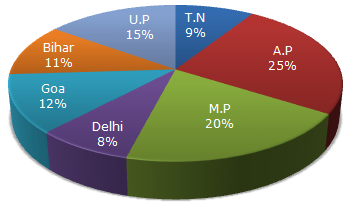
Total population of the given States = 3276000.
| States | Sex and Literacy wise Population Ratio | |||
| Sex | Literacy | |||
| M | F | Literate | Illiterate | |
| A.P | 5 | 3 | 2 | 7 |
| M.P | 3 | 1 | 1 | 4 |
| Delhi | 2 | 3 | 2 | 1 |
| Goa | 3 | 5 | 3 | 2 |
| Bihar | 3 | 4 | 4 | 1 |
| U.P. | 3 | 2 | 7 | 2 |
| T.N. | 3 | 4 | 9 | 4 |
3.
What is the ratio of the number of females in T.N. to the number of females in Delhi?
Answer: Option
Explanation:
| Required ratio |
|
|||||||||||||
|
||||||||||||||
|
||||||||||||||
|


Discussion:
4 comments Page 1 of 1.
Doreamon said:
6 years ago
Please give the Explanation.
Akshya gullipilli said:
6 years ago
Please anyone explain the answer.
Gayathrigayu said:
10 years ago
Can anyone explain this problem for me?
Shishir said:
1 decade ago
It should be option B because in Delhi it is 3/8.
Post your comments here:
Quick links
Quantitative Aptitude
Verbal (English)
Reasoning
Programming
Interview
Placement Papers