Data Interpretation - Pie Charts
Exercise : Pie Charts - Pie Chart 12
Directions to Solve
Study the following graph and the table and answer the questions given below.
Data of different states regarding population of states in the year 1998
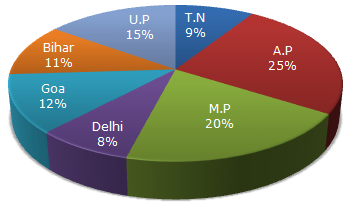
Total population of the given States = 3276000.
| States | Sex and Literacy wise Population Ratio | |||
| Sex | Literacy | |||
| M | F | Literate | Illiterate | |
| A.P | 5 | 3 | 2 | 7 |
| M.P | 3 | 1 | 1 | 4 |
| Delhi | 2 | 3 | 2 | 1 |
| Goa | 3 | 5 | 3 | 2 |
| Bihar | 3 | 4 | 4 | 1 |
| U.P. | 3 | 2 | 7 | 2 |
| T.N. | 3 | 4 | 9 | 4 |
1.
What will be the percentage of total number of males in U.P., M.P. and Goa together to the total population of all the given states?
Answer: Option
Explanation:
| Number of males in U.P = |  |
3 | of (15% of N) | ![]](/_files/images/data-interpretation/common/15-sym-cbracket-h1.gif) |
= | 3 | x | 15 | x N = 9 x | N | . |
| 5 | 5 | 100 | 100 |
where N = 3276000.
| Number of males in M.P = | |
3 | of (20% of N) | |
= | 3 | x | 20 | x N = 15 x | N | . |
| 4 | 4 | 100 | 100 |
| Number of males in Goa = | |
3 | of (12% of N) | |
= | 3 | x | 12 | x N = 4.5 x | N | . |
| 8 | 8 | 100 | 100 |
 Total number of males in these three states Total number of males in these three states |
|
|||||||
|


| Required Percentage = |
 |
|
x 100 | ![]](/_files/images/data-interpretation/common/15-sym-cbracket-h3.gif) |
% = 28.5%. | |||||
| N |
2.
What was the total number of illiterate people in A.P. and M.P. in 1998?
Answer: Option
Explanation:
| No. of illiterate people in A.P. = | |
7 | of (25% of 3276000) | |
= 637000. |
| 9 |
| No. of illiterate people in M.P. = | |
4 | of (20% of 3276000) | |
= 524160. |
| 5 |
Total number = (637000 + 524160) = 1161160.
3.
What is the ratio of the number of females in T.N. to the number of females in Delhi?
Answer: Option
Explanation:
| Required ratio |
|
|||||||||||||
|
||||||||||||||
|
||||||||||||||
|
4.
What was the number of males in U.P. in the year 1998?
Answer: Option
Explanation:
| Number of males in U.P. |
|
|||||||
|
||||||||
| = 294840. |
5.
If in the year 1998, there was an increase of 10% in the population of U.P. and 12% in the population of M.P. compared to the previous year, then what was the ratio of populations of U.P. and M.P. in 1997?
Answer: Option
Explanation:
Let x be the population of U.P. in 1997. Then,
| Population of U.P. in 1998 = 110% of x = | 110 | x x. |
| 100 |
Also, let y be the population of M.P. in 1997. Then,
| Population of M.P. in 1998 = 112% of y = | 112 | x y. |
| 100 |
| Ratio of populations of U.P. and M.P. in 1998 = |
|
= | 110x | . | |||||
|
112y |
| From the pie-chart, this ratio is | 15 | . |
| 20 |
|
110x | = | 15 |  |
x | = | 15 | x | 112 | = | 42 | . |
| 112y | 20 | y | 20 | 110 | 55 |
Thus, ratio of populations of U.P. and M.P. in 1997 = x : y = 42 : 55.
Quick links
Quantitative Aptitude
Verbal (English)
Reasoning
Programming
Interview
Placement Papers