Data Interpretation - Pie Charts
Exercise : Pie Charts - Pie Chart 9
Directions to Solve
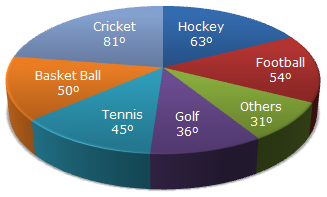
The circle-graph given here shows the spendings of a country on various sports during a particular year. Study the graph carefully and answer the questions given below it.
1.
What percent of total spending is spent on Tennis?
Answer: Option
Explanation:
| Percentage of money spend on Tennis = |  |
45 | x 100 |  |
% = 12 | 1 | %. |
| 360 | 2 |
2.
How much percent more is spent on Hockey than that on Golf?
Answer: Option
Explanation:
Let the total spendings on sports be Rs. x. Then,
| Amount spent on Golf = Rs. | |
36 | x x | |
= Rs. | x | . |
| 360 | 10 |
| Amount spent on Hockey = Rs | |
63 | x x | |
= Rs. | 7x | . |
| 360 | 40 |
| Difference = Rs. | |
7x | - | x | |
= Rs | 3x | . |
| 40 | 10 | 40 |
 Required percentage = Rs. Required percentage = Rs. |
 |
|
3x/40 | |
x 100 |  |
% = 75%. |
| x/10 |
3.
If the total amount spent on sports during the year be Rs. 1,80,00,000 , the amount spent on Basketball exceeds on Tennis by:
Answer: Option
Explanation:
Amount spent on Basketball exceeds that on Tennis by:
| Rs. | |
(50 - 45) | x 1,80,00,000 | |
= Rs. 2,50,000. |
| 360 |
4.
How much percent less is spent on Football than that on Cricket?
Answer: Option
Explanation:
Let the total spendings on sports be Rs. x. Then,
| Amount spent on Cricket = Rs. | |
81 | x x | |
= Rs. | 9x | . |
| 360 | 40 |
| Amount spent on Football = Rs | |
54 | x x | |
= Rs. | 3x | . |
| 360 | 20 |
| Difference = Rs. | |
9x | - | 3x | |
= Rs | 3x | . |
| 40 | 20 | 40 |
| Required percentage = Rs. |
|
|
3x/40 | |
x 100 | |
% = 33 | 1 | %. |
| 9x/40 | 3 |
5.
If the total amount spent on sports during the year was Rs. 2 crores, the amount spent on Cricket and Hockey together was:
Answer: Option
Explanation:
| Amount spent on Cricket and Hockey together |
|
|||||||
| = Rs. 0.8 crores | ||||||||
| = Rs. 80,00,000. |
Quick links
Quantitative Aptitude
Verbal (English)
Reasoning
Programming
Interview
Placement Papers