Data Interpretation - Bar Charts - Discussion
Discussion Forum : Bar Charts - Bar Chart 7 (Q.No. 4)
Directions to Solve
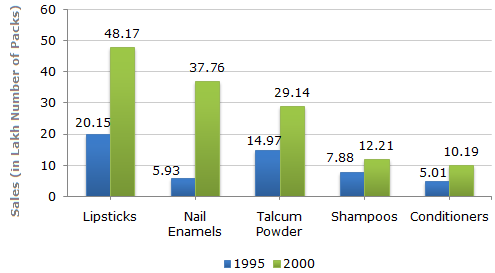
A cosmetic company provides five different products. The sales of these five products (in lakh number of packs) during 1995 and 2000 are shown in the following bar graph.
Sales (in lakh number of packs) of five different products of Cosmetic Company during 1995 and 2000
4.
The sales have increase by nearly 55% from 1995 to 2000 in the case of?
Answer: Option
Explanation:
The percentage increase from 1995 to 2000 for various products are:
| Lipsticks = |  |
(48.17 - 20.15) | x 100 | ![]](/_files/images/data-interpretation/common/15-sym-cbracket-h1.gif) |
% = 139.06%. |
| 20.15 |
| Nail enamels = | |
(37.76 - 5.93) | x 100 | |
% = 536.76%. |
| 5.93 |
| Talcum powders = | |
(29.14 - 14.97) | x 100 | |
% = 94.66%. |
| 14.97 |
| Shampoos = | |
(12.21 - 7.88) | x 100 | |
% = 54.95%  55%. 55%. |
| 7.88 |
| Conditioners = | |
(10.19 - 5.01) | x 100 | |
% = 103.39%. |
| 5.01 |
Discussion:
Be the first person to comment on this question !
Post your comments here:
Quick links
Quantitative Aptitude
Verbal (English)
Reasoning
Programming
Interview
Placement Papers