Online Data Interpretation Test - Data Interpretation Test 1
- This is a FREE online test. Beware of scammers who ask for money to attend this test.
- Total number of questions: 20.
- Time allotted: 30 minutes.
- Each question carries 1 mark; there are no negative marks.
- DO NOT refresh the page.
- All the best!
Marks : 2/20
Test Review : View answers and explanation for this test.
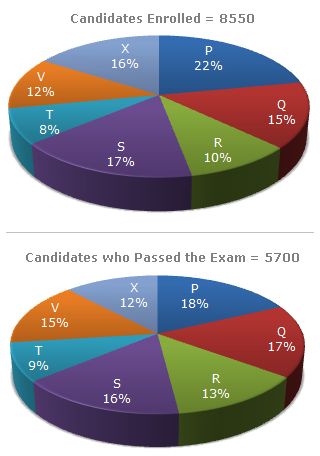
Study the following graph carefully and answer the questions given below:
Distribution of candidates who were enrolled for MBA entrance exam and the candidates (out of those enrolled) who passed the exam in different institutes:
| Required percentage = |  |
9% of 5700 | x 100 |  |
% = | |
9 x 5700 | x 100 | |
% = 75%. |
| 8% of 8550 | 8% of 8550 |
| Required ratio = | |
18% of 5700 | |
= | |
18 x 5700 | |
= | 6 | . |
| 22% of 8550 | 22 x 8550 | 11 |
| Candidates passed from institutes Q and R together | = [(13% + 17%) of 5700] |
| = 30% of 5700. | |
| Candidates enrolled from institutes Q and R together | = [(15% + 10%) of 8550] |
| = 25% of 8550. |
 Required Percentage Required Percentage |
|
|||||||
|
||||||||
| = 80%. |
The percentage of candidates passed to candidates enrolled can be determined for each institute as under:
| (i) P = |  |
|
18% of 5700 | |
x 100 | ![]](/_files/images/data-interpretation/common/15-sym-cbracket-h1.gif) |
% = | |
18 x 5700 | x 100 | |
% = 54.55%. |
| 22% of 8550 | 22 x 8550 |
| (ii) Q = | |
|
17% of 5700 | |
x 100 | |
% | = 75.56%. |
| 15% of 8550 |
| (iii) R = | |
|
13% of 5700 | |
x 100 | |
% | = 86.67%. |
| 10% of 8550 |
| (iv) S = | |
|
16% of 5700 | |
x 100 | |
% | = 62.75%. |
| 17% of 8550 |
| (v) T = | |
|
9% of 5700 | |
x 100 | |
% | = 75%. |
| 8% of 8550 |
| (vi) V = | |
|
15% of 5700 | |
x 100 | |
% | = 83.33%. |
| 12% of 8550 |
| (vii) X = | |
|
12% of 5700 | |
x 100 | |
% | = 50%. |
| 16% of 8550 |
Highest of these is 86.67% corresponding to institute R.
| Required difference | = [(16% + 18%) of 5700] - [(8% + 10%) of 8550] |
| = [(34% of 5700) - (18% of 8550)] | |
| = (1938 - 1539) | |
| = 399. |
Two different finance companies declare fixed annual rate of interest on the amounts invested with them by investors. The rate of interest offered by these companies may differ from year to year depending on the variation in the economy of the country and the banks rate of interest. The annual rate of interest offered by the two Companies P and Q over the years are shown by the line graph provided below.
Annual Rate of Interest Offered by Two Finance Companies Over the Years.
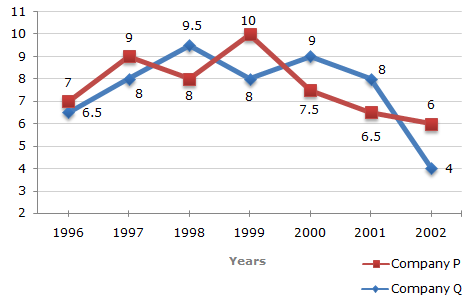
Let the amounts invested in 2002 in Companies P and Q be Rs. 8x and Rs. 9x respectively.
| Then, interest received after one year from Company P | = Rs. (6% of 8x) | ||||
|
|||||
| and interest received after one year from Company Q | = Rs. (4% of 9x) | ||||
|
| Required ratio = |
|
= | 4 | . | |||||
|
3 |
Let Rs. x lakhs be invested in Company P in 2000, the amount invested in Company Q in 2000 = Rs. (30 - x) lakhs.
Total interest received from the two Companies after 1 year
= Rs. [(7.5% of x) + {9% of (30 - x)}] lakhs
| = Rs. | |
2.7 - | |
1.5x | |
|
lakhs. |
| 100 |
| |
|
2.7 - | |
1.5x | |
|
= 2.43  x = 18. x = 18. |
| 100 |
| Difference | = Rs. [(10% of 4.75) - (8% of 4.75)] lakhs |
| = Rs. (2% of 4.75) lakhs | |
| = Rs. 0.095 lakhs | |
| = Rs. 9500. |
Amount received from Company P after one year (i.e., in 199) on investing Rs. 12 lakhs in it
= Rs. [12 + (8% of 12)] lakhs
= Rs. 12.96 lakhs.
Amount received from Company P after one year on investing Rs. 12.96 lakhs in the year 1999
= Rs. [12.96 + (10% of 12.96)] lakhs
= Rs. 14.256.
Appreciation received on investment during the period of two years
= Rs. (14.256 - 12) lakhs
= Rs. 2.256 lakhs
= Rs. 2,25,600.
Amount received from Company Q after one year on investment of Rs. 5 lakhs in the year 1996
= Rs. [5 + (6.5% of 5)] lakhs
= Rs. 5.325 lakhs.
Amount received from Company P after one year on investment of Rs. 5.325 lakhs in the year 1997
= Rs. [5.325 + (9% of 5.325)] lakhs
= Rs. 5.80425 lakhs
= Rs. 5,80,425.
The following table gives the sales of batteries manufactured by a company over the years.
Number of Different Types of Batteries Sold by a Company Over the Years (Numbers in Thousands)
| Year | Types of Batteries | |||||
| 4AH | 7AH | 32AH | 35AH | 55AH | Total | |
| 1992 | 75 | 144 | 114 | 102 | 108 | 543 |
| 1993 | 90 | 126 | 102 | 84 | 126 | 528 |
| 1994 | 96 | 114 | 75 | 105 | 135 | 525 |
| 1995 | 105 | 90 | 150 | 90 | 75 | 510 |
| 1996 | 90 | 75 | 135 | 75 | 90 | 465 |
| 1997 | 105 | 60 | 165 | 45 | 120 | 495 |
| 1998 | 115 | 85 | 160 | 100 | 145 | 605 |
The total sales (in thousands) of all the seven years for various batteries are:
For 4AH = 75 + 90 + 96 + 105 + 90 + 105 + 115 = 676
For 7AH = 144 + 126 + 114 + 90 + 75 + 60 + 85 = 694
For 32AH = 114 + 102 + 75 + 150 + 135 + 165 + 160 = 901
For 35AH = 102 + 84 + 105 + 90 + 75 + 45 + 100 = 601
For 55AH = 108 + 126 + 135 + 75 + 90 + 120 + 145 = 799.
Clearly, sales are maximum in case of 32AH batteries.
Required difference = [(84 - 45) x 1000] = 39000.
The percentages of sales of 4AH batteries to the total sales in different years are:
| For 1992 = | |
75 | x 100 | |
% = 13.81%. |
| 543 |
| For 1993 = | |
90 | x 100 | |
% = 17.05%. |
| 528 |
| For 1994 = | |
96 | x 100 | |
% = 18.29%. |
| 525 |
| For 1995 = | |
105 | x 100 | |
% = 20.59%. |
| 510 |
| For 1996 = | |
96 | x 100 | |
% = 19.35%. |
| 465 |
| For 1997 = | |
105 | x 100 | |
% = 21.21%. |
| 495 |
| For 1998 = | |
115 | x 100 | |
% = 19.01%. |
| 605 |
Clearly, the percentage is maximum in 1997.
From the table it is clear that the sales of 7AH batteries have been decreasing continuously from 1992 to 1997.
| Required percentage |
|
|||||||
| = 34.26% | ||||||||
 34%. 34%. |
The bar graph given below shows the percentage distribution of the total production of a car manufacturing company into various models over two years.
Percentage of Six different types of Cars manufactured by a Company over Two Years
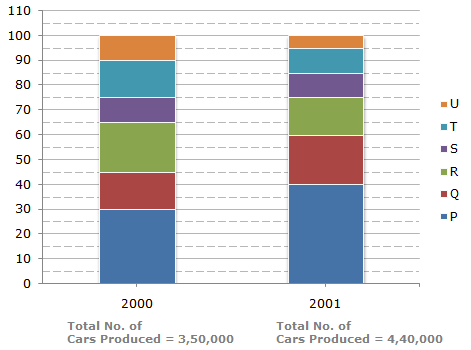
Analysis of the graph:
We shall first determine the number of cars of each model produced by the Company during the two years:
In 2000 : Total number of cars produced = 3,50,000.
P = (30 - 0)% of 3,50,000 = 30% of 3,50,000 = 1,05,000.
Q = (45 - 30)% of 3,50,000 = 15% of 3,50,000 = 52,500.
R = (65 - 45)% of 3,50,000 = 20% of 3,50,000 = 70,000.
S = (75 - 65)% of 3,50,000 = 10% of 3,50,000 = 35,000.
T = (90 - 75)% of 3,50,000 = 15% of 3,50,000 = 52,500.
U = (100 - 90)% of 3,50,000 = 10% of 3,50,000 = 35,000.
In 2001 : Total number of cars produced = 4,40,000.
P = (40 - 0)% of 4,40,000 = 40% of 4,40,000 = 1,76,000.
Q = (60 - 40)% of 4,40,000 = 20% of 4,40,000 = 88,000.
R = (75 - 60)% of 4,40,000 = 15% of 4,40,000 = 66,000.
S = (85 - 75)% of 4,40,000 = 10% of 4,40,000 = 44,000.
T = (95 - 85)% of 4,40,000 = 10% of 4,40,000 = 44,000.
U = (100 - 95)% of 4,40,000 = 5% of 4,40,000 = 22,000.
Total number of cars of models P, Q and T manufacture in 2000
= (105000 + 52500 + 52500)
= 2,10,000.
The percentage change (rise/fall) in production from 2000 to 2001 for various models is:
| For P = | |
(176000 - 105000) | x 100 | |
% = 67.62%, rise. |
| 105000 |
| For Q = | |
(88000 - 52500) | x 100 | |
% = 67.62%, rise. |
| 52500 |
| For R = | |
(70000 - 66000) | x 100 | |
% = 5.71%, fall. |
| 70000 |
| For S = | |
(44000 - 35000) | x 100 | |
% = 25.71%, rise. |
| 35000 |
| For T = | |
(52500 - 44000) | x 100 | |
% = 16.19%, fall. |
| 52500 |
| For U = | |
(35000 - 22000) | x 100 | |
% = 37.14%, fall. |
| 35000 |
Minimum percentage rise/fall is production is the case of model R.
Total number of Q type cars produced in 2001
=(60 - 40)% of 4,40,000 = 88,000.
Total number of Q type cars produced in 2000
=(45 - 30)% of 3,50,000 = 52,500.
Required difference = (88000 - 52500) = 35,500.
If the percentage production of P type cars in 2001
= Percentage production of P type cars in 2000
= 30%.
then, number of P type cars produced in 2001
= 30% of 4,40,000
= 1,32,000.
Number of S type cars which remained unsold in 2000 = 15% of 35,000
and number of S type cars which remained unsold in 2001 = 15% of 44,000.
Total number of S type cars which remained unsold
= 15% of (35,000 + 44,000)
= 15% of 79,000
= 11,850.