Online Data Interpretation Test - Data Interpretation Test 2
- This is a FREE online test. Beware of scammers who ask for money to attend this test.
- Total number of questions: 20.
- Time allotted: 30 minutes.
- Each question carries 1 mark; there are no negative marks.
- DO NOT refresh the page.
- All the best!
Marks : 2/20
Test Review : View answers and explanation for this test.
The following bar chart shows the trends of foreign direct investments(FDI) into India from all over the world.
Trends of FDI in India
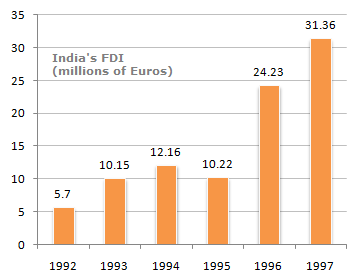
The difference in investments over 1996-1997 was
31.36 - 24.23 = € 7.13 millions.
Let x be the FDI in 1997.
Then: (2/5.7) = (x/31.36)
x = (2/5.7) x 31.36
x = 11
The following pie-charts show the distribution of students of graduate and post-graduate levels in seven different institutes in a town.
Distribution of students at graduate and post-graduate levels in seven institutes:
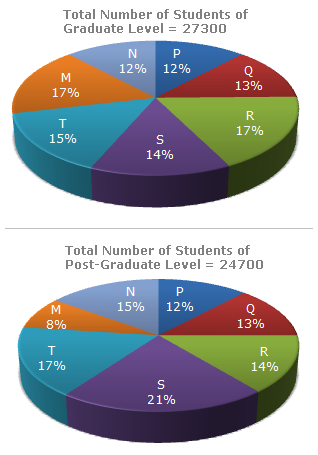
Students of institute M at graduate level= 17% of 27300 = 4641.
Students of institute S at graduate level = 14% of 27300 = 3822.
 Total number of students at graduate in institutes M and S Total number of students at graduate in institutes M and S |
= (4641 + 3822) |
| = 8463. |
| Required number | = (15% of 24700) + (12% of 24700) |
| = 3705 + 2964 | |
| = 6669. |
| Required number | = (17% of 27300) + (14% of 24700) |
| = 4641 + 3458 | |
| = 8099. |
| Required ratio = | (21% of 24700) | = | (21 x 24700) | = | 19 | . |
| (14% of 27300) | 14 x 27300 | 14 |
| Required ratio = | (21% of 24700) | = | (21 x 24700) | = | 19 | . |
| (13% of 27300) | 13 x 27300 | 13 |
The following line graph gives the percentage of the number of candidates who qualified an examination out of the total number of candidates who appeared for the examination over a period of seven years from 1994 to 2000.
Percentage of Candidates Qualified to Appeared in an Examination Over the Years
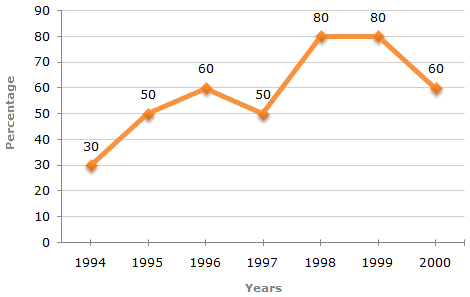
The differences between the percentages of candidates qualified to appeared for the give pairs of years are:
For 1994 and 1995 = 50 - 30 = 20.
For 1998 and 1999 = 80 - 80 = 0.
For 1994 and 1997 = 50 - 30 = 20.
For 1997 and 1998 = 80 - 50 = 30.
For 1999 and 2000 = 80 - 60 = 20.
Thus, the maximum difference is between the years 1997 and 1998.
The graph gives the data for the percentage of candidates qualified to appeared and unless the absolute values of number of candidates qualified or candidates appeared is know we cannot compare the absolute values for any two years.
Hence, the data is inadequate to solve this question.
The number of candidates appeared in 1998 be x.
Then, 80% of x = 21200  x = x = |
21200 x 100 | = 26500 (required number). |
| 80 |
The total number of candidates qualified in 1996 and 1997 together, cannot be determined until we know at least, the number of candidates appeared in any one of the two years 1996 or 1997 or the percentage of candidates qualified to appeared in 1996 and 1997 together.
Hence, the data is inadequate.
The number of candidates qualified in 1999 = (80% of 26500) = 21200.
Number of candidates qualified in 2000 = (33500 - 21200) = 12300.
Let the number of candidates appeared in 2000 be x.
| Then, 60% of x = 12300 x = |
 |
12300 x 100 |  |
= 20500. |
| 60 |
A school has four sections A, B, C, D of Class IX students.
The results of half yearly and annual examinations are shown in the table given below.
| Result | No. of Students | |||
| Section A | Section B | Section C | Section D | |
| Students failed in both Exams | 28 | 23 | 17 | 27 |
| Students failed in half-yearly but passed in Annual Exams | 14 | 12 | 8 | 13 |
| Students passed in half-yearly but failed in Annual Exams | 6 | 17 | 9 | 15 |
| Students passed in both Exams | 64 | 55 | 46 | 76 |
Since the classification of the students on the basis of their results and sections form independent groups, so the total number of students in the class:
= (28 + 23 + 17 + 27 + 14 + 12 + 8 + 13 + 6 + 17 + 9 + 15 + 64 + 55 + 46 + 76)
= 430.
Total number of failures in half-yearly exams in a section
= [ (Number of students failed in both exams)
+ (Number of students failed in half-yearly but passed in Annual exams)
] in that section
Failure rate in half-yearly exams in Section A
| = |  |
Number of students of Section A failed in half-yearly | x 100 | ![]](/_files/images/data-interpretation/common/15-sym-cbracket-h1.gif) |
% |
| Total number of students in Section A |
| = | |
(28 + 14) | x 100 | |
% |
| (28 + 14 + 6 + 64) |
| = | |
42 | x 100 | |
% |
| 112 |
= 37.5%.
Similarly, failure rate in half-yearly exams in:
| Section B | |
(23 + 12) | x 100 | |
% = | |
35 | x 100 | |
% = 32.71%. |
| (23 + 12 + 17 + 55) | 107 |
| Section C | |
(17 + 8) | x 100 | |
% = | |
25 | x 100 | |
% = 31.25%. |
| (17 + 8 + 9 + 46) | 80 |
| Section D | |
(27 + 13) | x 100 | |
% = | |
40 | x 100 | |
% = 30.53%. |
| (27 + 13 + 15 + 76) | 131 |
Clearly, the failure rate is minimum for Section D.
Total number of students passed in annual exams in a section
= [ (No. of students failed in half-yearly but passed in annual exams)
+ (No. of students passed in both exams)
] in that section
Success rate in annual exams in Section A
| = | |
No. of students of Section A passed in annual exams | x 100 | |
% |
| Total number of students in Section A |
| = | |
(14 + 64) | x 100 | |
% |
| (28 + 14 + 6 + 64) |
| = | |
78 | x 100 | |
% |
| 112 |
= 69.64%.
Similarly, success rate in annual exams in:
| Section B | |
(12 + 55) | x 100 | |
% = | |
67 | x 100 | |
% = 62.62%. |
| (23 + 12 + 17 + 55) | 107 |
| Section C | |
(8 + 46) | x 100 | |
% = | |
54 | x 100 | |
% = 67.5%. |
| (17 + 8 + 9 + 46) | 80 |
| Section D | |
(13 + 76) | x 100 | |
% = | |
89 | x 100 | |
% = 67.94%. |
| (27 + 13 + 15 + 76) | 131 |
Clearly, the success rate in annual examination is maximum for Section A.
Pass percentages in at least one of the two examinations for different sections are:
| For Section A | |
(14 + 6 + 64) | x 100 | |
% = | |
84 | x 100 | |
% = 75%. |
| (28 + 14 + 6 + 64) | 112 |
| For Section B | |
(12 + 17 + 55) | x 100 | |
% = | |
84 | x 100 | |
% = 78.5%. |
| (23 + 12 + 17 + 55) | 107 |
| For Section C | |
(8 + 9 + 46) | x 100 | |
% = | |
63 | x 100 | |
% = 78.75%. |
| (17 + 8 + 9 + 46) | 80 |
| For Section D | |
(13 + 15 + 76) | x 100 | |
% = | |
104 | x 100 | |
% = 79.39%. |
| (27 + 13 + 15 + 76) | 131 |
Clearly, the pass percentage is maximum for Section D.
Number of students who passed half-yearly exams in the school
= (Number of students passed in half-yearly but failed in annual exams)
+ (Number of students passed in both exams)
= (6 + 17 + 9 + 15) + (64 + 55 + 46 + 76)
= 288.
Also, Number of students who passed annual exams in the school
= (Number of students failed in half-yearly but passed in annual exams)
+ (Number of students passed in both exams)
= (14 + 12 + 8 + 13) + (64 + 55 + 46 + 76)
= 288.
Since, the number of students passed in half-yearly = the number of students passed in annual exams. Therefore, it can be inferred that both the examinations had almost the same difficulty level.
Thus Statements (a), (b) and (d) are false and Statement (c) is true.