Data Interpretation - Line Charts - Discussion
Discussion Forum : Line Charts - Line Chart 5 (Q.No. 3)
Directions to Solve
The following line graph gives the percentage of the number of candidates who qualified an examination out of the total number of candidates who appeared for the examination over a period of seven years from 1994 to 2000.
Percentage of Candidates Qualified to Appeared in an Examination Over the Years
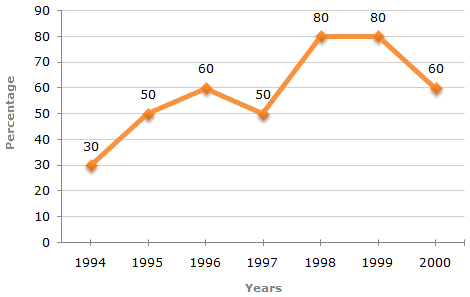
3.
If the number of candidates qualified in 1998 was 21200, what was the number of candidates appeared in 1998?
Answer: Option
Explanation:
The number of candidates appeared in 1998 be x.
Then, 80% of x = 21200  x = x = |
21200 x 100 | = 26500 (required number). |
| 80 |
Discussion:
Be the first person to comment on this question !
Post your comments here:
Quick links
Quantitative Aptitude
Verbal (English)
Reasoning
Programming
Interview
Placement Papers