Data Interpretation - Pie Charts - Discussion
Discussion Forum : Pie Charts - Pie Chart 6 (Q.No. 3)
Directions to Solve
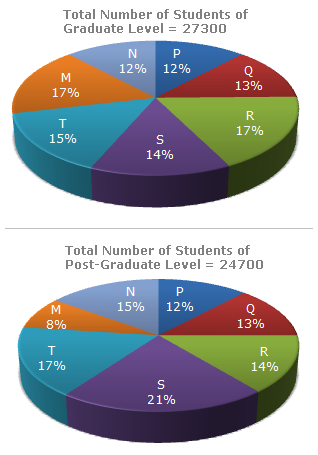
The following pie-charts show the distribution of students of graduate and post-graduate levels in seven different institutes in a town.
Distribution of students at graduate and post-graduate levels in seven institutes:
3.
How many students of institutes of M and S are studying at graduate level?
Answer: Option
Explanation:
Students of institute M at graduate level= 17% of 27300 = 4641.
Students of institute S at graduate level = 14% of 27300 = 3822.
 Total number of students at graduate in institutes M and S Total number of students at graduate in institutes M and S |
= (4641 + 3822) |
| = 8463. |
Discussion:
Be the first person to comment on this question !
Post your comments here:
Quick links
Quantitative Aptitude
Verbal (English)
Reasoning
Programming
Interview
Placement Papers