Data Interpretation - Bar Charts - Discussion
Discussion Forum : Bar Charts - Bar Chart 15 (Q.No. 1)
Directions to Solve
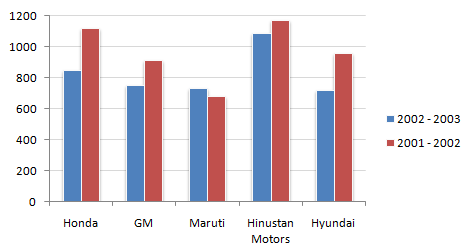
Study the following bar chart and answer the questions carefully.
Sales Turnover of 5 Companies (in Rs. crores)
1.
What is the percentage change in the overall sales turnover of the five companies together between 2001 - 2002 and 2002 - 2003 ?
Answer: Option
Explanation:
The required answer is
100 - percentage value of the fraction (Absolute change/first year's value).
Discussion:
13 comments Page 1 of 2.
Prasant said:
1 decade ago
2001-02: approx. 1100+900+650+1150+950 = 4750
2002-03: approx. 850+750+700+1050+700 = 4050
% change = (4750-4050)*100/4750 = 14.73% (approx)Hence, chose the near one option.
Absolute value = (approx)4750-4050 = 700 (chose the near one option)
2002-03: approx. 850+750+700+1050+700 = 4050
% change = (4750-4050)*100/4750 = 14.73% (approx)Hence, chose the near one option.
Absolute value = (approx)4750-4050 = 700 (chose the near one option)
(5)
Chris said:
7 years ago
There are no precise numbers, thus meaning you have to give an estimate to where the chart is?
(3)
Chirayu said:
1 decade ago
{(4750-4050)*100}/4750 = 14.68
(2)
Sharmila said:
7 years ago
Denominator value is the base value.
Base value is the one with which we compare the growth.
Here, in this case, the value has been changed from the year 2001-02 to 2002 -03.
So, 2001-02 total is taken as the base value.
Base value is the one with which we compare the growth.
Here, in this case, the value has been changed from the year 2001-02 to 2002 -03.
So, 2001-02 total is taken as the base value.
(2)
Pradeep said:
1 decade ago
Like other bar charts, value should be given on the top of lines to calculate. Approximately, everyone has given the right calculation:
4750-4050 = 700.
(700/4750)*100 = 14.73% near to 14.68%.
Option (B).
4750-4050 = 700.
(700/4750)*100 = 14.73% near to 14.68%.
Option (B).
(1)
Msl said:
8 years ago
How to take denominator value?
(1)
Chaithanya said:
2 decades ago
In this the explanation of q, 1 is not clear please explain briefly.
Aanya said:
2 decades ago
Its ok i got it , the ans is 14.7%
Aanya said:
2 decades ago
The explanation is not clear, can anyone explain.
Sriram said:
1 decade ago
Give the analysis of solution please.
Post your comments here:
Quick links
Quantitative Aptitude
Verbal (English)
Reasoning
Programming
Interview
Placement Papers