Data Interpretation - Bar Charts - Discussion
Discussion Forum : Bar Charts - Bar Chart 15 (Q.No. 1)
Directions to Solve
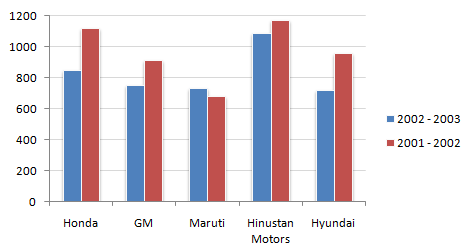
Study the following bar chart and answer the questions carefully.
Sales Turnover of 5 Companies (in Rs. crores)
1.
What is the percentage change in the overall sales turnover of the five companies together between 2001 - 2002 and 2002 - 2003 ?
Answer: Option
Explanation:
The required answer is
100 - percentage value of the fraction (Absolute change/first year's value).
Discussion:
13 comments Page 2 of 2.
Sai said:
1 decade ago
Can anyone explain it clearly.
Govind said:
1 decade ago
Add up all the 2001+2002 sales turnover carefully, and all the 2002+2003 values.
Than find the change percentage thereafter you will get the answer not accurately 14.68%.
Than find the change percentage thereafter you will get the answer not accurately 14.68%.
ParthaUrfGo0fY said:
1 decade ago
Add all the sales of both 2001-2002 and 2002-2003 separately. And find out the difference. And divide the difference by 2001-2002 add up sales. Mind it, during summation of the sales, all the sale are not exactly of round fig. i.e. it may contain 810, 840, 960 like that.
Thank you. :).
Thank you. :).
Post your comments here:
Quick links
Quantitative Aptitude
Verbal (English)
Reasoning
Programming
Interview
Placement Papers