Data Interpretation - Bar Charts - Discussion
Discussion Forum : Bar Charts - Bar Chart 15 (Q.No. 1)
Directions to Solve
Study the following bar chart and answer the questions carefully.
Sales Turnover of 5 Companies (in Rs. crores)
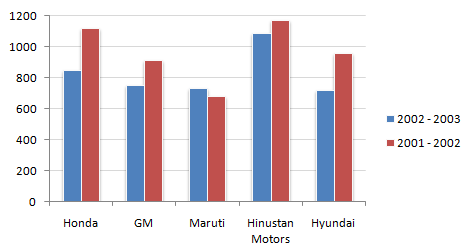
1.
What is the percentage change in the overall sales turnover of the five companies together between 2001 - 2002 and 2002 - 2003 ?
Answer: Option
Explanation:
The required answer is
100 - percentage value of the fraction (Absolute change/first year's value).
Discussion:
13 comments Page 2 of 2.
Aanya said:
2 decades ago
Its ok i got it , the ans is 14.7%
Aanya said:
2 decades ago
The explanation is not clear, can anyone explain.
Chaithanya said:
2 decades ago
In this the explanation of q, 1 is not clear please explain briefly.
Post your comments here:
Quick links
Quantitative Aptitude
Verbal (English)
Reasoning
Programming
Interview
Placement Papers