Online Data Interpretation Test - Data Interpretation Test 3
- This is a FREE online test. Beware of scammers who ask for money to attend this test.
- Total number of questions: 20.
- Time allotted: 30 minutes.
- Each question carries 1 mark; there are no negative marks.
- DO NOT refresh the page.
- All the best!
Marks : 2/20
Test Review : View answers and explanation for this test.
Study the following pie-diagrams carefully and answer the questions given below it:
Percentage Composition of Human Body
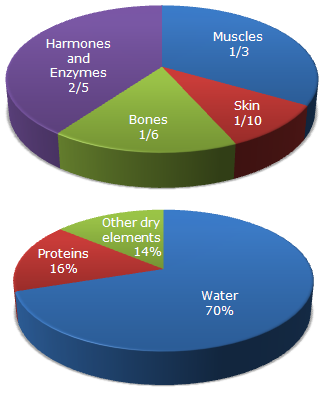
| Part of the body made of neither bones nor skin = 1 - |  |
1 | + | 1 |  |
= | 11 | . |
| 6 | 10 | 15 |
| Required ratio = |
|
= | 6 | = | 2 | . | |||||
|
3 | 1 |
| Quantity of water in the body of a person weighing 50 kg | = (70% of 50) kg |
| = 35 kg. |
Let the body weight be x kg.
| Then, weight of skin protein in the body |
|
||||||||||
|
 Required percentage = Required percentage = |
 |
|
x 100 | ![]](/_files/images/data-interpretation/common/15-sym-cbracket-h3.gif) |
% = 1.6%. | ||||
| x |
| Percentage of proteins and other dry elements in the body | = (16% + 14%) |
| = 30%. | |
| Central angle corresponding to proteins and other dry elements together |
|
| = 30% of 360° | |
| = 108°. | |
Study the following line graph which gives the number of students who joined and left the school in the beginning of year for six years, from 1996 to 2001.
Initial Strength of school in 1995 = 3000.
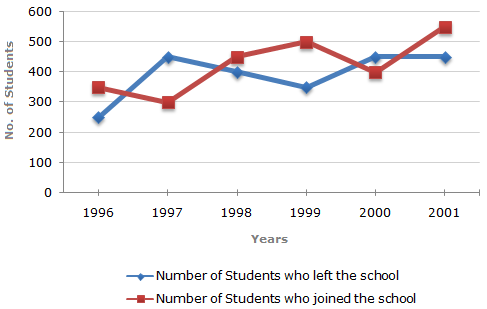
Important data noted from the given graph:
In 1996 : Number of students left = 250 and number of students joined = 350.
In 1997 : Number of students left = 450 and number of students joined = 300.
In 1998 : Number of students left = 400 and number of students joined = 450.
In 1999 : Number of students left = 350 and number of students joined = 500.
In 2000 : Number of students left = 450 and number of students joined = 400.
In 2001 : Number of students left = 450 and number of students joined = 550.
Therefore, the numbers of students studying in the school (i.e., strength of the school) in various years:
In 1995 = 3000 (given).
In 1996 = 3000 - 250 + 350 = 3100.
In 1997 = 3100 - 450 + 300 = 2950.
In 1998 = 2950 - 400 + 450 = 3000.
In 1999 = 3000 - 350 + 500 = 3150.
In 2000 = 3150 - 450 + 400 = 3100.
In 2001 = 3100 - 450 + 550 = 3200.
Percentage increase in the strength of the school from 1997 to 1998
| = |  |
(3000 - 2950) | x 100 | ![]](/_files/images/data-interpretation/common/15-sym-cbracket-h1.gif) |
% = 1.69%  1.7%. 1.7%. |
| 2950 |
As calculated above, the number of students studying in the school during 1999 = 3150.
As calculated above, in the years 1996 and 2000 the strength of the school was same i.e., 3100.
| Required percentage = | |
3000 | x 100 | |
% = 93.75% |
| 3200 |
As calculated above, the largest number of students (i.e., 550) joined the school in the year 2001.
Study the following table and answer the questions.
Classification of 100 Students Based on the Marks Obtained by them in Physics and Chemistry in an Examination.
| Subject | Marks out of 50 | ||||
| 40 and above | 30 and above | 20 and above | 10 and above | 0 and above | |
| Physics | 9 | 32 | 80 | 92 | 100 |
| Chemistry | 4 | 21 | 66 | 81 | 100 |
| Average (Aggregate) | 7 | 27 | 73 | 87 | 100 |
| We have 40% of 50 = | |
40 | x 50 | |
= 20. |
| 100 |
Required number
= Number of students scoring less than 20 marks in aggreagate
= 100 - Number of students scoring 20 and above marks in aggregate
= 100 - 73
= 27.
| We have 60% of 50 = | |
60 | x 50 | |
= 30. |
| 100 |
Required number
= No. of students scoring 30 and above marks in Physics
= 32
Required difference
= (No. of students scoring 30 and above marks in Chemistry)
- (Number of students scoring 30 and above marks in aggregate)
= 27 - 21
= 6.
Number of students getting at least 60% marks in Chemistry
= Number of students getting 30 and above marks in Chemistry
= 21.
Number of students getting at least 40% marks in aggregate
= Number of students getting 20 and above marks in aggregate
= 73.
| Required percentage |
|
|||||||
| = 28.77% | ||||||||
| 29%. |
Since 66 students get 20 and above marks in Chemistry and out of these 21 students get 30 and above marks, therefore to select top 35 students in Chemistry, the qualifying marks should lie in the range 20-30.
Study the bar chart and answer the question based on it.
Production of Fertilizers by a Company (in 1000 tonnes) Over the Years
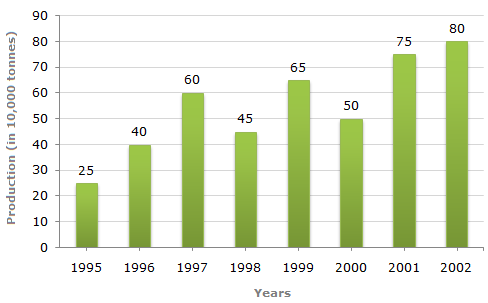
Average production (in 10000 tonnes) over the given years
| = | 1 | (25 + 40 + 60 + 45 + 65 + 50 + 75 + 80) = 55. |
| 8 |
The productions during the years 1997, 1999, 2001 and 2002 are more than the average production.
| Average production (in 10000 tonnes) of 1996 and 1997 | 40 + 60 | = 50. |
| 2 |
We shall find the average production (in 10000 tonnes) for each of the given alternative pairs:
| 2000 and 2001 = | 50 + 75 | = 62.5. |
| 2 |
| 1999 and 2000 = | 65 + 50 | = 57.5. |
| 2 |
| 1998 and 2000 = | 45 + 50 | = 47.5. |
| 2 |
| 1995 and 1999 = | 25 + 65 | = 45. |
| 2 |
| 1995 and 2001 = | 25 + 75 | = 50. |
| 2 |
The average production of 1996 and 1997 is equal to the average production of 1995 and 2001.
| Required percentage = | |
(45 - 60) | |
% = -25%. |
| 60 |
There is a decline of 25% in production from 1997 to 1998.
The percentage increase in production compared to previous year for different years are:
| In 1996 = | |
(40 - 25) | x 100 | |
% = 60%. |
| 25 |
| In 1997 = | |
(60 - 40) | x 100 | |
% = 50%. |
| 40 |
In 1998 there is a decrease in production.
| In 1999 = | |
(65 - 45) | x 100 | |
% = 44.44%. |
| 45 |
In 2000 there is a decrease in production.
| In 2001 = | |
(75 - 50) | x 100 | |
% = 50%. |
| 50 |
| In 2002 = | |
(80 - 75) | x 100 | |
% = 6.67%. |
| 75 |
Clearlyl, there is maximum percentage increase in production in 1996.
| Required percentage = | |
(80 - 25) | x 100 | |
% = 220%. |
| 25 |