Data Interpretation - Pie Charts - Discussion
Discussion Forum : Pie Charts - Pie Chart 10 (Q.No. 1)
Directions to Solve
Study the following graph carefully and answer the questions given below:
Distribution of candidates who were enrolled for MBA entrance exam and the candidates (out of those enrolled) who passed the exam in different institutes:
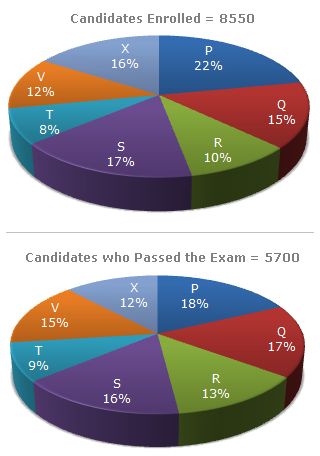
1.
What percentage of candidates passed the Exam from institute T out of the total number of candidates enrolled from the same institute?
Answer: Option
Explanation:
| Required percentage = |  |
9% of 5700 | x 100 |  |
% = | |
9 x 5700 | x 100 | |
% = 75%. |
| 8% of 8550 | 8% of 8550 |
Discussion:
22 comments Page 3 of 3.
Atin gupta said:
1 decade ago
@ malika arjun :
Its quite simple divide what is the total and multiply what you are getting into 100.
Its quite simple divide what is the total and multiply what you are getting into 100.
Ramesh solanki said:
2 decades ago
8*100/8550=684
Post your comments here:
Quick links
Quantitative Aptitude
Verbal (English)
Reasoning
Programming
Interview
Placement Papers