Data Interpretation - Pie Charts - Discussion
Discussion Forum : Pie Charts - Pie Chart 4 (Q.No. 1)
Directions to Solve
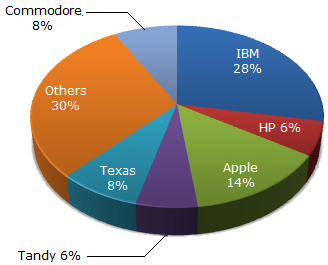
The pie chart shows the distribution of New York market share by value of different computer companies in 2005.
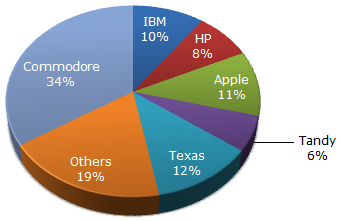
The pie chart shows the distribution of New York market share by volume of different computer companies in 2005.
Number of units sold in 2005 in New York = 1,500
Value of units sold in 2005 in New York = US $1,650,000.
1.
For the year 2005, which company has realised the lowest average unit sales price for a PC ?
Answer: Option
Explanation:
Although it seems to be Commodore, the answer cannot be determined due to the fact that we are unaware of the break-up of the sales value and volume of companies compromising the other categories.
Discussion:
30 comments Page 1 of 3.
Ravi said:
1 decade ago
The answer is commodore. Dont know why they have written that the answer can't be determined. Its share can be calculated which is 8% of the total share value.
Similarly no. of units can be calculated which is 34% of 1500. So we can easily calculate the avg value by dividing by no. of units and the answer will be 258.82.
Similarly no. of units can be calculated which is 34% of 1500. So we can easily calculate the avg value by dividing by no. of units and the answer will be 258.82.
Sharon said:
2 years ago
Please check - OTHERS category.
Now there can be multiple companies in -the OTHERS category (which would be different than those listed in question like Dell or Lenovo etc).
Since there any multiple companies involved in the OTHERS category, we cannot determine who has the lowest AV unit price.
Hope it helps.
Now there can be multiple companies in -the OTHERS category (which would be different than those listed in question like Dell or Lenovo etc).
Since there any multiple companies involved in the OTHERS category, we cannot determine who has the lowest AV unit price.
Hope it helps.
(4)
Varun said:
1 decade ago
@ All.
The procedure for finding a single unit sales value is to VALUE by VOLUME.
But as others section is unknown (it can be anything) we might have the lowest value from any of those companies hence commodore can't be concluded as the lowest.
The procedure for finding a single unit sales value is to VALUE by VOLUME.
But as others section is unknown (it can be anything) we might have the lowest value from any of those companies hence commodore can't be concluded as the lowest.
(1)
Sanket sharma said:
5 years ago
The procedure for finding a single unit sales value is to VALUE by VOLUME.
But as another section is unknown (it can be anything) we might have the lowest value from any of those companies hence commodore can't be concluded as the lowest.
But as another section is unknown (it can be anything) we might have the lowest value from any of those companies hence commodore can't be concluded as the lowest.
(1)
NIRANJAN said:
8 years ago
The answer is COMMODORE,
Because if we calculate for IBM PC in average unit sale price in question 3 of this section, which answer is $3080 per unit.
Same is for all, where we found that lowest is Commodore ($259 per unit).
Because if we calculate for IBM PC in average unit sale price in question 3 of this section, which answer is $3080 per unit.
Same is for all, where we found that lowest is Commodore ($259 per unit).
(1)
Harsh verma said:
1 decade ago
We can find
=(value * per company percentage in value pie chart)/(volume * percentage company in volume chart).
By this we get individual sale for all the companies and we able to compare.
So why answer be undetermined?
=(value * per company percentage in value pie chart)/(volume * percentage company in volume chart).
By this we get individual sale for all the companies and we able to compare.
So why answer be undetermined?
Subhash said:
1 decade ago
This question is same as (similar) to question no 4 of this pie chart. When we can find the answer of that question then I don't understand why are you saying "we don't know out of 100 how many sold and at what price".
KOUSHIK GARG said:
2 years ago
I think that value and volume are given for NEW YORK from this data we can find value and volume for individual companies also by taking a percentage of a particular amount.
Please correct me if I'm wrong.
Please correct me if I'm wrong.
(2)
Shital said:
1 decade ago
Here volume and value of "Other" category is shown. But "OTHER" section may consist of computers of different company and different value. So we can't find out value of individual unit of "OTHER" section.
Satya Jeet Verma said:
6 years ago
Here we can not determine because we only know how many units are sold but don't know at what price it is sold because here cumulative price is given but individual company laptop price is not given.
(3)
Post your comments here:
Quick links
Quantitative Aptitude
Verbal (English)
Reasoning
Programming
Interview
Placement Papers