Data Interpretation - Pie Charts - Discussion
Discussion Forum : Pie Charts - Pie Chart 4 (Q.No. 1)
Directions to Solve
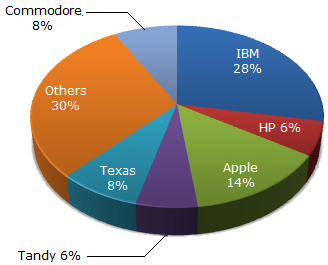
The pie chart shows the distribution of New York market share by value of different computer companies in 2005.
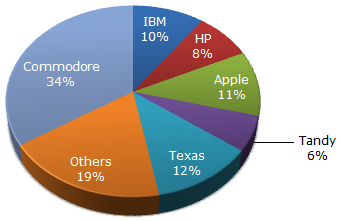
The pie chart shows the distribution of New York market share by volume of different computer companies in 2005.
Number of units sold in 2005 in New York = 1,500
Value of units sold in 2005 in New York = US $1,650,000.
1.
For the year 2005, which company has realised the lowest average unit sales price for a PC ?
Answer: Option
Explanation:
Although it seems to be Commodore, the answer cannot be determined due to the fact that we are unaware of the break-up of the sales value and volume of companies compromising the other categories.
Discussion:
30 comments Page 3 of 3.
Charles said:
9 years ago
I'm confused there's like two 6 percent in the 2005 pie chart why is it going with commodore?
Sameer said:
1 decade ago
Read the question twice because, it is questioning about lowest average unit sale.
Swapnil said:
1 decade ago
We can find the individual values using; value/units = price /unit.
Yuki said:
6 years ago
Which is the correct answer, A or D? Please tell me.
(1)
Rishabh said:
1 decade ago
Its answer would come as we solve question 3 here.
Lakhwinder singh said:
9 years ago
Unable to understand it. Please someone help me.
Abhishek said:
1 decade ago
What is distribution by value and by volume?
Raj said:
8 years ago
I don't understand. Please help me.
Versha said:
1 decade ago
It is not clear please explain.
Kishor said:
6 years ago
Answer should be A.
Post your comments here:
Quick links
Quantitative Aptitude
Verbal (English)
Reasoning
Programming
Interview
Placement Papers