Data Interpretation - Line Charts
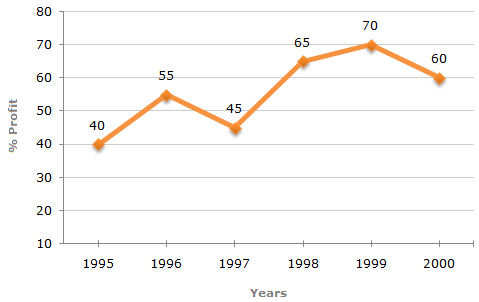
The following line graph gives the annual percent profit earned by a Company during the period 1995 - 2000.
Percent Profit Earned by a Company Over the Years.
| %Profit = | Income - Expenditure | x 100 |
| Expenditure |
| It is given that : % Profit = | Income - Expenditure | x 100 |
| Expenditure |
 |
% Profit | = | Income | - 1 |
| 100 | Expenditure |
| |
Income | = | % Profit | + 1. |
| Expenditure | 100 |
From this it is clear that the ratio of income to expenditure is minimum for the year in which the % Profit has the minimum value. Since, out of given years (i.e., out of 1996, 1997, 1998, 1999 and 2000), the Company has the minimum % profit in the year 1997.
So the minimum ratio of income to expenditure is in the year 1997.
The ratio percentage profit earned to that in the previous year, for different years are:
| For 1996 = | 55 | = 1.38; |
| 40 |
| For 1997 = | 45 | = 0.82; |
| 55 |
| For 1998 = | 65 | = 1.44; |
| 45 |
| For 1999 = | 70 | = 1.08; |
| 65 |
| For 2000 = | 60 | = 0.86; |
| 70 |
Clearly, this ratio is minimum for 1997.
Let the expenditure is 1997 be x.
| Then, expenditure in 2000 = x + (25% of x) = | 5 | x. |
| 4 |
Also, let the incomes in 1997 and 2000 be I1 and I2 respectively.
Then, for the year 1997, we have:
| 45 = | I1 - x | x 100 |
45 | = | I1 | -1 I1 = |
145x | = 1.45x. |
| x | 100 | x | 100 |
Also, for year 2000, we have:
| 60 = |
|
x 100 |
60 | = | 4I2 | - 1 I2 = |
160 | x | 5x | = 2x. | |||||
|
100 | 5x | 100 | 4 |
Difference between the two income = (2x - 1.45x) = 0.55x.
 Percentage by which I1 is less than I2 = Percentage by which I1 is less than I2 = |
 |
0.55x | x 100 |  |
% = 27.5%. |
| 2x |