Data Interpretation - Line Charts - Discussion
Discussion Forum : Line Charts - Line Chart 6 (Q.No. 8)
Directions to Solve
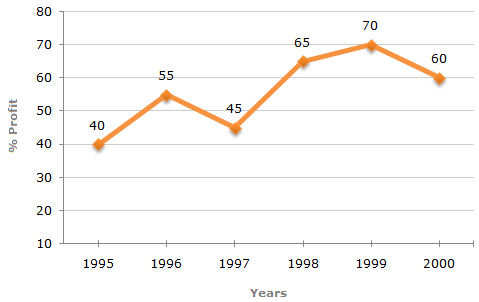
The following line graph gives the annual percent profit earned by a Company during the period 1995 - 2000.
Percent Profit Earned by a Company Over the Years.
| %Profit = | Income - Expenditure | x 100 |
| Expenditure |
8.
If the expenditure in 2000 is 25% more than expenditure in 1997, then the income in 1997 is what percent less than the income in 2000?
Answer: Option
Explanation:
Let the expenditure is 1997 be x.
| Then, expenditure in 2000 = x + (25% of x) = | 5 | x. |
| 4 |
Also, let the incomes in 1997 and 2000 be I1 and I2 respectively.
Then, for the year 1997, we have:
| 45 = | I1 - x | x 100  |
45 | = | I1 | -1 I1 = |
145x | = 1.45x. |
| x | 100 | x | 100 |
Also, for year 2000, we have:
| 60 = |
|
x 100 |
60 | = | 4I2 | - 1 I2 = |
160 | x | 5x | = 2x. | |||||
|
100 | 5x | 100 | 4 |
Difference between the two income = (2x - 1.45x) = 0.55x.
 Percentage by which I1 is less than I2 = Percentage by which I1 is less than I2 = |
 |
0.55x | x 100 |  |
% = 27.5%. |
| 2x |
Discussion:
6 comments Page 1 of 1.
Lll said:
5 years ago
Let the expenditure of 1998 be 'x'.
Expenditure 2000 ....x +( 25% of x).
X+(25/100*x),
X+(0.25*x),
X+ 0 25x,
1.25x.
(1.25 * 100 = 125).
125/100 =1 1/4 = 5/4x.
Expenditure 2000 ....x +( 25% of x).
X+(25/100*x),
X+(0.25*x),
X+ 0 25x,
1.25x.
(1.25 * 100 = 125).
125/100 =1 1/4 = 5/4x.
(2)
Yoezer said:
6 years ago
I didn't understand clearly. Someone can kindly help me please.
(1)
Kunsel said:
6 years ago
Can anyone explain me from where did 5/4 come from?
Singh said:
9 years ago
(I)1 = 145 x/100=1.45 x.
x+x*25/100=5/4x,
(I)2= 160*(5/4x)/100=2x,
Percent less =(2x-1.45x)/2x = .55x*100/2x = 27.5%.
x+x*25/100=5/4x,
(I)2= 160*(5/4x)/100=2x,
Percent less =(2x-1.45x)/2x = .55x*100/2x = 27.5%.
(1)
Prateek said:
10 years ago
Can anyone tell an alternate method please?
Sivaraj said:
1 decade ago
Short cut please?
Post your comments here:
Quick links
Quantitative Aptitude
Verbal (English)
Reasoning
Programming
Interview
Placement Papers