Data Interpretation - Line Charts - Discussion
Discussion Forum : Line Charts - Line Chart 6 (Q.No. 7)
Directions to Solve
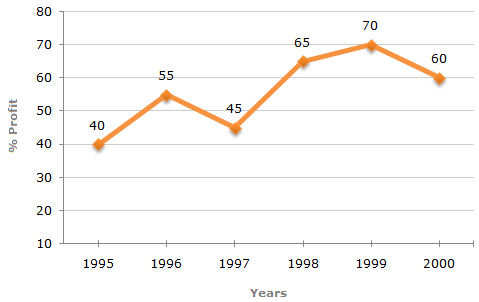
The following line graph gives the annual percent profit earned by a Company during the period 1995 - 2000.
Percent Profit Earned by a Company Over the Years.
| %Profit = | Income - Expenditure | x 100 |
| Expenditure |
7.
During which year the ratio of percentage profit earned to that in the previous year is the minimum?
Answer: Option
Explanation:
The ratio percentage profit earned to that in the previous year, for different years are:
| For 1996 = | 55 | = 1.38; |
| 40 |
| For 1997 = | 45 | = 0.82; |
| 55 |
| For 1998 = | 65 | = 1.44; |
| 45 |
| For 1999 = | 70 | = 1.08; |
| 65 |
| For 2000 = | 60 | = 0.86; |
| 70 |
Clearly, this ratio is minimum for 1997.
Discussion:
Be the first person to comment on this question !
Post your comments here:
Quick links
Quantitative Aptitude
Verbal (English)
Reasoning
Programming
Interview
Placement Papers