Data Interpretation - Bar Charts - Discussion
Discussion Forum : Bar Charts - Bar Chart 9 (Q.No. 4)
Directions to Solve
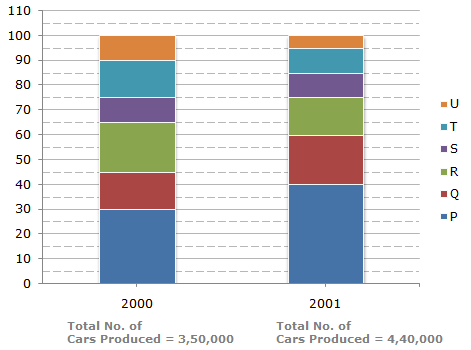
The bar graph given below shows the percentage distribution of the total production of a car manufacturing company into various models over two years.
Percentage of Six different types of Cars manufactured by a Company over Two Years
4.
If 85% of the S type cars produced in each year were sold by the company, how many S type cars remain unsold?
Answer: Option
Explanation:
Number of S type cars which remained unsold in 2000 = 15% of 35,000
and number of S type cars which remained unsold in 2001 = 15% of 44,000.
 Total number of S type cars which remained unsold
= 15% of (35,000 + 44,000)
= 15% of 79,000
= 11,850.
Discussion:
16 comments Page 2 of 2.
Sonam said:
1 decade ago
@A.J question was to find the total no.of S type car unsold, not total car unsold.
Prateek said:
10 years ago
Why is not multiplied by 350000 and 440000 respectively in above question?
Nilekani Nandan said:
7 years ago
= 15% (10% of 350k + 10% of 440k).
= 15% (790),
= 11850.
= 15% (790),
= 11850.
(2)
Riri said:
8 years ago
Exactly as 10% shown in bar graph.
(1)
Ramki said:
1 decade ago
10% cars is how to convert 15%.
Chinu said:
1 decade ago
IT should 15% of 10%?
Post your comments here:
Quick links
Quantitative Aptitude
Verbal (English)
Reasoning
Programming
Interview
Placement Papers