Data Interpretation - Bar Charts - Discussion
Discussion Forum : Bar Charts - Bar Chart 5 (Q.No. 1)
Directions to Solve
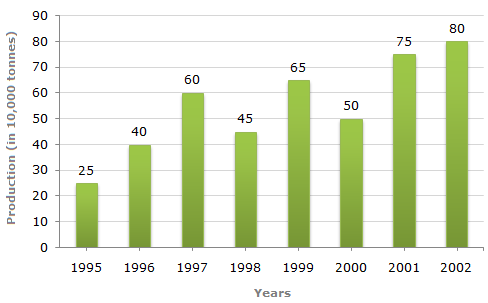
Study the bar chart and answer the question based on it.
Production of Fertilizers by a Company (in 1000 tonnes) Over the Years
1.
What was the percentage decline in the production of fertilizers from 1997 to 1998?
Answer: Option
Explanation:
| Required percentage = |  |
(45 - 60) | ![]](/_files/images/data-interpretation/common/15-sym-cbracket-h1.gif) |
% = -25%. |
| 60 |
 There is a decline of 25% in production from 1997 to 1998.
Discussion:
12 comments Page 1 of 2.
Sabyasachi said:
5 years ago
When they asked for 1997 to 1998 we should take 1998 as a denominator so the answer will be 33.33%.
(3)
Raza said:
1 decade ago
Why (45-60)?
Why not (60-45)?
And can you elaborate the answer for me.
Why not (60-45)?
And can you elaborate the answer for me.
(2)
Lakshmi narayana.P said:
10 years ago
Why doesn't (60 - 45) take?
(2)
Dileep said:
7 years ago
Why we take (45-60)/45?
(2)
Don rd said:
1 decade ago
Because we have to see from the year from which the production is declined means year from which the device started. Here in 1997 production was 60,000 and it started dropping down to 45,000. So whenever declined is to be calculated it has to be calculated with respect to the high value from where the degradation started.
(1)
Shweta said:
1 decade ago
Because of percentage decline ask in question.
(1)
Dhivya said:
8 years ago
Why doesn't take (60-45)?
Anyone elaborate, please.
Anyone elaborate, please.
(1)
Sangay Choden said:
5 years ago
Can anyone elaborate in detail? please.
(1)
Romita said:
1 decade ago
Why devided by 60 ?
Karthik kuppa said:
10 years ago
@Raza. Here there is nothing to elaborate. The question was asked in a negative way. So we have to get the answer in negative value. So we have to do it as 45-60 instead of 60-45. Thank you. :).
Post your comments here:
Quick links
Quantitative Aptitude
Verbal (English)
Reasoning
Programming
Interview
Placement Papers