Data Interpretation - Bar Charts - Discussion
Discussion Forum : Bar Charts - Bar Chart 5 (Q.No. 1)
Directions to Solve
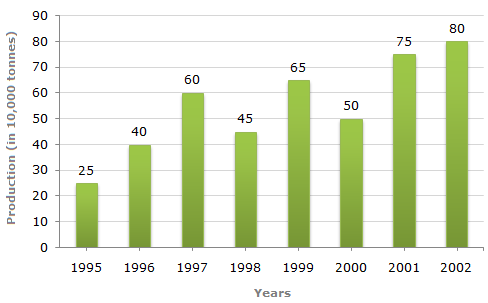
Study the bar chart and answer the question based on it.
Production of Fertilizers by a Company (in 1000 tonnes) Over the Years
1.
What was the percentage decline in the production of fertilizers from 1997 to 1998?
Answer: Option
Explanation:
| Required percentage = |  |
(45 - 60) | ![]](/_files/images/data-interpretation/common/15-sym-cbracket-h1.gif) |
% = -25%. |
| 60 |
 There is a decline of 25% in production from 1997 to 1998.
Discussion:
12 comments Page 1 of 2.
Aiswarya said:
4 months ago
Percentage change = New − Old/Old ×100.
So, the year 1997 is an old one with the value 60,
And 1998 is the new one with the value 45.
So from the above formula.
Percentage change = 45 - 60/60 * 100 = -25%.
So there is 25% decline.
So, the year 1997 is an old one with the value 60,
And 1998 is the new one with the value 45.
So from the above formula.
Percentage change = 45 - 60/60 * 100 = -25%.
So there is 25% decline.
Sabyasachi said:
5 years ago
When they asked for 1997 to 1998 we should take 1998 as a denominator so the answer will be 33.33%.
(3)
Sangay Choden said:
5 years ago
Can anyone elaborate in detail? please.
(1)
Dileep said:
7 years ago
Why we take (45-60)/45?
(2)
Bhavani said:
7 years ago
(60-45) /45 = 1500/45.
= 33.3%.
The answer is not a negative percentage so because we can calculate interchange the year value because ask in question the decline percentage. The decline means a negative percentage.
= 33.3%.
The answer is not a negative percentage so because we can calculate interchange the year value because ask in question the decline percentage. The decline means a negative percentage.
Dhivya said:
8 years ago
Why doesn't take (60-45)?
Anyone elaborate, please.
Anyone elaborate, please.
(1)
Lakshmi narayana.P said:
10 years ago
Why doesn't (60 - 45) take?
(2)
Karthik kuppa said:
10 years ago
@Raza. Here there is nothing to elaborate. The question was asked in a negative way. So we have to get the answer in negative value. So we have to do it as 45-60 instead of 60-45. Thank you. :).
Shweta said:
1 decade ago
Because of percentage decline ask in question.
(1)
Raza said:
1 decade ago
Why (45-60)?
Why not (60-45)?
And can you elaborate the answer for me.
Why not (60-45)?
And can you elaborate the answer for me.
(2)
Post your comments here:
Quick links
Quantitative Aptitude
Verbal (English)
Reasoning
Programming
Interview
Placement Papers