Electronics and Communication Engineering - Networks Analysis and Synthesis - Discussion
Discussion Forum : Networks Analysis and Synthesis - Section 21 (Q.No. 7)
7.
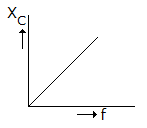
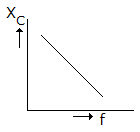
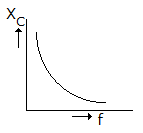
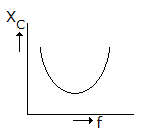
Which of the following graphs in figure correctly represents the variation of capacitive reactance with frequency?
Discussion:
Be the first person to comment on this question !
Post your comments here:
Quick links
Quantitative Aptitude
Verbal (English)
Reasoning
Programming
Interview
Placement Papers