Electronics and Communication Engineering - Automatic Control Systems - Discussion
Discussion Forum : Automatic Control Systems - Section 7 (Q.No. 16)
16.
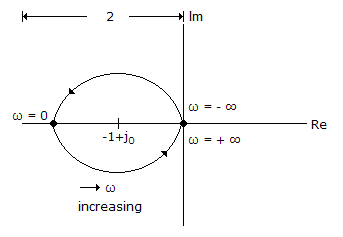
The Nyquist plot in the given figure is for G(s) H(s) =


Discussion:
Be the first person to comment on this question !
Post your comments here:
Quick links
Quantitative Aptitude
Verbal (English)
Reasoning
Programming
Interview
Placement Papers