Data Interpretation - Pie Charts - Discussion
Discussion Forum : Pie Charts - Pie Chart 10 (Q.No. 2)
Directions to Solve
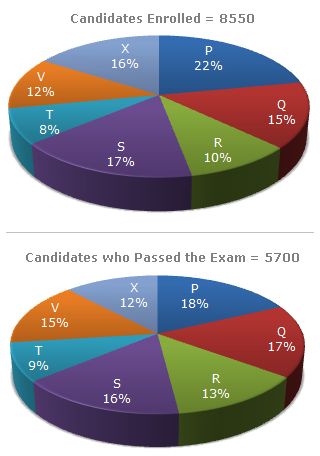
Study the following graph carefully and answer the questions given below:
Distribution of candidates who were enrolled for MBA entrance exam and the candidates (out of those enrolled) who passed the exam in different institutes:
2.
Which institute has the highest percentage of candidates passed to the candidates enrolled?
Answer: Option
Explanation:
The percentage of candidates passed to candidates enrolled can be determined for each institute as under:
| (i) P = |  |
 |
18% of 5700 |  |
x 100 | ![]](/_files/images/data-interpretation/common/15-sym-cbracket-h1.gif) |
% = | |
18 x 5700 | x 100 | |
% = 54.55%. |
| 22% of 8550 | 22 x 8550 |
| (ii) Q = | |
|
17% of 5700 | |
x 100 | |
% | = 75.56%. |
| 15% of 8550 |
| (iii) R = | |
|
13% of 5700 | |
x 100 | |
% | = 86.67%. |
| 10% of 8550 |
| (iv) S = | |
|
16% of 5700 | |
x 100 | |
% | = 62.75%. |
| 17% of 8550 |
| (v) T = | |
|
9% of 5700 | |
x 100 | |
% | = 75%. |
| 8% of 8550 |
| (vi) V = | |
|
15% of 5700 | |
x 100 | |
% | = 83.33%. |
| 12% of 8550 |
| (vii) X = | |
|
12% of 5700 | |
x 100 | |
% | = 50%. |
| 16% of 8550 |
Highest of these is 86.67% corresponding to institute R.
Discussion:
16 comments Page 2 of 2.
Raymond said:
2 decades ago
Is there any shortcut method to solve this problem?
Vinod said:
1 decade ago
Difference b/w numerator and denominator is max.
Madan said:
1 decade ago
@Mukesh: Can you please elaborate your answer?
Gursheel said:
9 years ago
Great work, thanks for shortcut @Nishad.
(1)
Chanchal said:
9 years ago
Thanks for the best shortcut @Nishad.
Shubhu said:
8 years ago
@Pravin.
8/6= 1.3 not 1.13.
8/6= 1.3 not 1.13.
(1)
Post your comments here:
Quick links
Quantitative Aptitude
Verbal (English)
Reasoning
Programming
Interview
Placement Papers