Data Interpretation - Pie Charts - Discussion
Discussion Forum : Pie Charts - Pie Chart 10 (Q.No. 1)
Directions to Solve
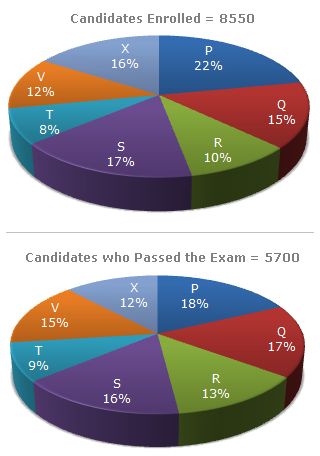
Study the following graph carefully and answer the questions given below:
Distribution of candidates who were enrolled for MBA entrance exam and the candidates (out of those enrolled) who passed the exam in different institutes:
1.
What percentage of candidates passed the Exam from institute T out of the total number of candidates enrolled from the same institute?
Answer: Option
Explanation:
| Required percentage = |  |
9% of 5700 | x 100 |  |
% = | |
9 x 5700 | x 100 | |
% = 75%. |
| 8% of 8550 | 8% of 8550 |
Discussion:
22 comments Page 3 of 3.
Chandhu said:
4 years ago
Simple method :
First, find the 8 % of 8550 it will be = 684.
Next, find the 9% of 5700 it will be = 513.
Last step 513/684 * 100 = 75%.
First, find the 8 % of 8550 it will be = 684.
Next, find the 9% of 5700 it will be = 513.
Last step 513/684 * 100 = 75%.
(24)
Haradas Mohanta said:
2 years ago
Thanks for the clear explanation @Pravi.
(1)
Post your comments here:
Quick links
Quantitative Aptitude
Verbal (English)
Reasoning
Programming
Interview
Placement Papers