Data Interpretation - Bar Charts - Discussion
Discussion Forum : Bar Charts - Bar Chart 9 (Q.No. 5)
Directions to Solve
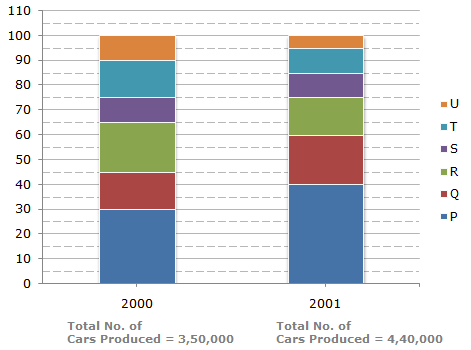
The bar graph given below shows the percentage distribution of the total production of a car manufacturing company into various models over two years.
Percentage of Six different types of Cars manufactured by a Company over Two Years
5.
For which model the percentage rise/fall in production from 2000 to 2001 was minimum?
Answer: Option
Explanation:
The percentage change (rise/fall) in production from 2000 to 2001 for various models is:
| For P = |  |
(176000 - 105000) | x 100 | ![]](/_files/images/data-interpretation/common/15-sym-cbracket-h1.gif) |
% = 67.62%, rise. |
| 105000 |
| For Q = | |
(88000 - 52500) | x 100 | |
% = 67.62%, rise. |
| 52500 |
| For R = | |
(70000 - 66000) | x 100 | |
% = 5.71%, fall. |
| 70000 |
| For S = | |
(44000 - 35000) | x 100 | |
% = 25.71%, rise. |
| 35000 |
| For T = | |
(52500 - 44000) | x 100 | |
% = 16.19%, fall. |
| 52500 |
| For U = | |
(35000 - 22000) | x 100 | |
% = 37.14%, fall. |
| 35000 |
 Minimum percentage rise/fall is production is the case of model R.
Discussion:
19 comments Page 1 of 2.
Golu said:
2 years ago
How 1760000? Please explain to me.
MUSKAN MANSURI said:
3 years ago
2001 for p (40-0)%of 440000 - 2000 for p (30-0)%350000/for p (30-0)%350000.
Solution:
Step 1: 40/100 * 440000-30/100 * 350000/30/100 * 350000 * 100.
Step 2: 176000-105000/105000 * 100.
Step 3 : 67.61%.
The same follows for q,r,s,t & u.
Solution:
Step 1: 40/100 * 440000-30/100 * 350000/30/100 * 350000 * 100.
Step 2: 176000-105000/105000 * 100.
Step 3 : 67.61%.
The same follows for q,r,s,t & u.
(1)
Techi Nania said:
3 years ago
Yes, can anyone explain how 176000 came? Please.
Binita said:
5 years ago
176000 from where it came? Please explain.
Ashwin said:
7 years ago
Can someone explain why we are dividing?
Harinandan kumar said:
8 years ago
How did you calculate the percentage of P? Please explain in detail.
Pooja rajput said:
8 years ago
How did you calculate the percentage of change of P?
Mission shahi said:
8 years ago
Not getting it. Please explain it clearly.
(1)
Vishal said:
9 years ago
Maximum is Q why it say that is R.
Bill said:
9 years ago
Thanks @Neha.
Post your comments here:
Quick links
Quantitative Aptitude
Verbal (English)
Reasoning
Programming
Interview
Placement Papers