Data Interpretation - Bar Charts - Discussion
Discussion Forum : Bar Charts - Bar Chart 9 (Q.No. 5)
Directions to Solve
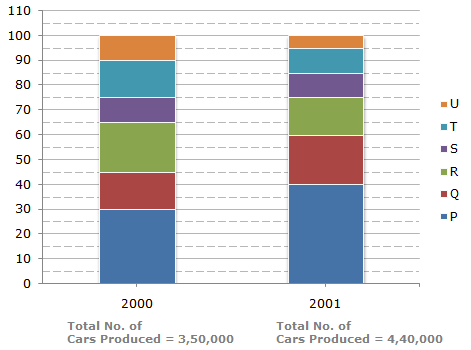
The bar graph given below shows the percentage distribution of the total production of a car manufacturing company into various models over two years.
Percentage of Six different types of Cars manufactured by a Company over Two Years
5.
For which model the percentage rise/fall in production from 2000 to 2001 was minimum?
Answer: Option
Explanation:
The percentage change (rise/fall) in production from 2000 to 2001 for various models is:
| For P = |  |
(176000 - 105000) | x 100 | ![]](/_files/images/data-interpretation/common/15-sym-cbracket-h1.gif) |
% = 67.62%, rise. |
| 105000 |
| For Q = | |
(88000 - 52500) | x 100 | |
% = 67.62%, rise. |
| 52500 |
| For R = | |
(70000 - 66000) | x 100 | |
% = 5.71%, fall. |
| 70000 |
| For S = | |
(44000 - 35000) | x 100 | |
% = 25.71%, rise. |
| 35000 |
| For T = | |
(52500 - 44000) | x 100 | |
% = 16.19%, fall. |
| 52500 |
| For U = | |
(35000 - 22000) | x 100 | |
% = 37.14%, fall. |
| 35000 |
 Minimum percentage rise/fall is production is the case of model R.
Discussion:
19 comments Page 2 of 2.
Sachin k said:
1 decade ago
350x = 440y find x/y almost equals 1.26 find respective ratio closer to 1.26 will be the answer check for given options for are x/y equals 1.33 for R 1.5.
Soumya said:
1 decade ago
Not able to understand. Please explain it clearly.
Ankit said:
1 decade ago
We take previous year as divisor.
Jaay said:
1 decade ago
Can we solve it by just observing the graph ? Any shortcut ?
Ronak said:
1 decade ago
It entirely depends on rise or fall and that is clear from the picture itself. As we are solving this question for rise or fall hence that term comes in then. With respect to which there is a rise or fall in the production.
Farheen said:
1 decade ago
Sometimes we are taking total no.of cars produced in 2000 as divisor and sometimes 2001 why?
Depending on Which criteria are we declaring it 'fail' or 'pass'?
Depending on Which criteria are we declaring it 'fail' or 'pass'?
Neha said:
1 decade ago
Do not solve each and every question asked. What options are given try solving those only.
Eg: In this problem, Q,R,S,T given. So, solve only those not all.
Eg: In this problem, Q,R,S,T given. So, solve only those not all.
Ashutosh said:
1 decade ago
Its take too much time please explain in short method.
(2)
Srinivas reddy said:
2 decades ago
Is there any shortcut for this problem?
(2)
Post your comments here:
Quick links
Quantitative Aptitude
Verbal (English)
Reasoning
Programming
Interview
Placement Papers