Data Interpretation - Line Charts - Discussion
Discussion Forum : Line Charts - Line Chart 9 (Q.No. 5)
Directions to Solve
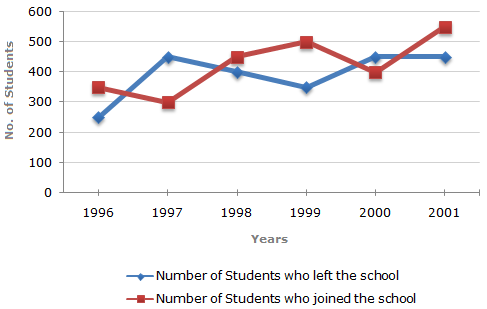
Study the following line graph which gives the number of students who joined and left the school in the beginning of year for six years, from 1996 to 2001.
Initial Strength of school in 1995 = 3000.
5.
The ratio of the least number of students who joined the school to the maximum number of students who left the school in any of the years during the given period is?
Answer: Option
Explanation:
| Required ratio = | 300 | = | 2 | . |
| 450 | 3 |
Discussion:
4 comments Page 1 of 1.
Dinho said:
9 years ago
We can directly see the variation between the no. Of student join oh no and leaving for the particular year.
So, in 1997 there is a huge variation.
No. Of student joining/no of Student leaving.
300/450=2:3.
So, in 1997 there is a huge variation.
No. Of student joining/no of Student leaving.
300/450=2:3.
(1)
Vishnu said:
6 years ago
@Bobby.
In question, they have given that, least number of students who joined so by graph the year 1997 has least number 300 so we consider the year 1997.
In question, they have given that, least number of students who joined so by graph the year 1997 has least number 300 so we consider the year 1997.
(1)
Suraj Nazare said:
10 years ago
Can you please get the proper solving of this question for me.
(2)
Bobby said:
8 years ago
Why 1997, why not another year?
Please explain.
Please explain.
(1)
Post your comments here:
Quick links
Quantitative Aptitude
Verbal (English)
Reasoning
Programming
Interview
Placement Papers