Data Interpretation - Line Charts - Discussion
Discussion Forum : Line Charts - Line Chart 6 (Q.No. 1)
Directions to Solve
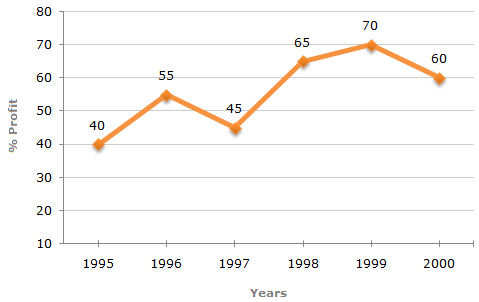
The following line graph gives the annual percent profit earned by a Company during the period 1995 - 2000.
Percent Profit Earned by a Company Over the Years.
| %Profit = | Income - Expenditure | x 100 |
| Expenditure |
1.
If the expenditures in 1996 and 1999 are equal, then the approximate ratio of the income in 1996 and 1999 respectively is?
Answer: Option
Explanation:
Let the expenditure in 1996 = x.
Also, let the incomes in 1996 and 1999 be I1 and I2 respectively.
Then, for the year 1996, we have:
| 55 = | I1 - x | x 100 |  |
55 | = | I1 | - 1 | I1 = |
155x | ... (i) |
| x | 100 | x | 100 |
| 70 = | I2 - x | x 100 | |
70 | = | I2 | - 1 | I2 = |
170x | ... (ii) |
| x | 100 | x | 100 |
From (i) and (ii), we get:
| I1 | = |
|
= | 155 |  |
0.91 | 9 : 10. |
|||||
| I2 |
|
170 | 1 |


Discussion:
11 comments Page 1 of 2.
Rajat saini said:
1 decade ago
Let us 34 is 100%.
Then calculate percentage 31 and I found it 91.
Then we have 91/100 == 9.1/10.
Then question is talking about approximately so we can write it as 9/10.
Then calculate percentage 31 and I found it 91.
Then we have 91/100 == 9.1/10.
Then question is talking about approximately so we can write it as 9/10.
(1)
Arun Kumar Gajmer said:
5 years ago
How does it came 155x? please explain.
(1)
Lakshmi said:
1 decade ago
How it becomes 9:10?
I got 31:34.
I got 31:34.
Sivaraj said:
1 decade ago
Same problem for me! Could you explain how is it 9:10?
Arjun said:
1 decade ago
Please explain I got only 31:34 how answer will be 9:10?
Shefali said:
10 years ago
Yes, my answer is also 31 : 34.
Piyush said:
10 years ago
Yes, I too got the answer as 31 : 34.
Raga said:
10 years ago
Actually none of these should be answer. Because without income or exp cannot find the answer.
Abhilasha mishra said:
10 years ago
Can not be determined. Please help me.
Jeni said:
9 years ago
I too got 31: 34.
Post your comments here:
Quick links
Quantitative Aptitude
Verbal (English)
Reasoning
Programming
Interview
Placement Papers