Data Interpretation - Line Charts - Discussion
Discussion Forum : Line Charts - Line Chart 6 (Q.No. 1)
Directions to Solve
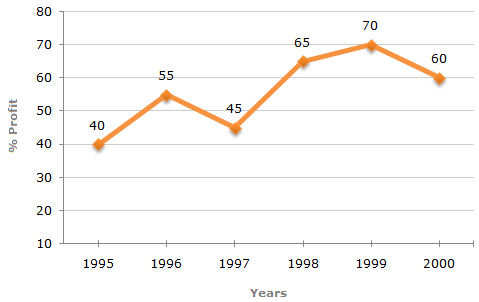
The following line graph gives the annual percent profit earned by a Company during the period 1995 - 2000.
Percent Profit Earned by a Company Over the Years.
| %Profit = | Income - Expenditure | x 100 |
| Expenditure |
1.
If the expenditures in 1996 and 1999 are equal, then the approximate ratio of the income in 1996 and 1999 respectively is?
Answer: Option
Explanation:
Let the expenditure in 1996 = x.
Also, let the incomes in 1996 and 1999 be I1 and I2 respectively.
Then, for the year 1996, we have:
| 55 = | I1 - x | x 100 |  |
55 | = | I1 | - 1 | I1 = |
155x | ... (i) |
| x | 100 | x | 100 |
| 70 = | I2 - x | x 100 | |
70 | = | I2 | - 1 | I2 = |
170x | ... (ii) |
| x | 100 | x | 100 |
From (i) and (ii), we get:
| I1 | = |
|
= | 155 |  |
0.91 | 9 : 10. |
|||||
| I2 |
|
170 | 1 |


Discussion:
11 comments Page 2 of 2.
Anirudh said:
9 years ago
31/34 = 0.9
= 0.9 change in fraction form ( 9/10*10/10) = 9/10 form and ratio form 9:10.
= 0.9 change in fraction form ( 9/10*10/10) = 9/10 form and ratio form 9:10.
Post your comments here:
Quick links
Quantitative Aptitude
Verbal (English)
Reasoning
Programming
Interview
Placement Papers