Data Interpretation - Line Charts - Discussion
Discussion Forum : Line Charts - Line Chart 5 (Q.No. 4)
Directions to Solve
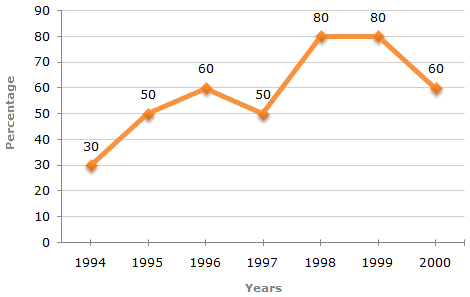
The following line graph gives the percentage of the number of candidates who qualified an examination out of the total number of candidates who appeared for the examination over a period of seven years from 1994 to 2000.
Percentage of Candidates Qualified to Appeared in an Examination Over the Years
4.
If the total number of candidates appeared in 1996 and 1997 together was 47400, then the total number of candidates qualified in these two years together was?
Answer: Option
Explanation:
The total number of candidates qualified in 1996 and 1997 together, cannot be determined until we know at least, the number of candidates appeared in any one of the two years 1996 or 1997 or the percentage of candidates qualified to appeared in 1996 and 1997 together.
Hence, the data is inadequate.
Discussion:
4 comments Page 1 of 1.
Kasinath @Hyd said:
1 decade ago
Candidates Appeared in 1996+1997 = 47400.
Candidates Qualified in 1996+1997 = Q.
Percentage of Qualified to Appeared in 1996+1997 = 60+50 = 110%.
Qualified/Appeared = 110%.
=>Q/47400 = 110/100.
=>Q=(110/100)/47400 = 11*4740.
Qualified Students = 52140.
Answer is None of the above.
Candidates Qualified in 1996+1997 = Q.
Percentage of Qualified to Appeared in 1996+1997 = 60+50 = 110%.
Qualified/Appeared = 110%.
=>Q/47400 = 110/100.
=>Q=(110/100)/47400 = 11*4740.
Qualified Students = 52140.
Answer is None of the above.
(2)
Tenzin Namgay said:
8 years ago
Please explain the solution.
Sidharth said:
7 years ago
I didn't understand. Please Give me a suggestion.
Durga said:
1 year ago
We cannot simply add percentages, as they are obtained on different values.
Hence the answer is D.
Hence the answer is D.
Post your comments here:
Quick links
Quantitative Aptitude
Verbal (English)
Reasoning
Programming
Interview
Placement Papers