Data Interpretation - Bar Charts - Discussion
Discussion Forum : Bar Charts - Bar Chart 12 (Q.No. 1)
Directions to Solve
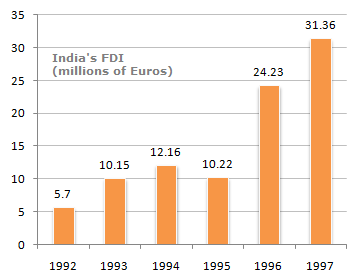
The following bar chart shows the trends of foreign direct investments(FDI) into India from all over the world.
Trends of FDI in India
1.
What was the ratio of investment in 1997 over the investment in 1992 ?
Answer: Option
Explanation:
The 1997 figure of investment as a factor of 1992 investment = (31.36/5.70) = 5.50
Discussion:
3 comments Page 1 of 1.
Narmadha said:
3 years ago
31.50/5.70.
= 3150/570,
= 5.50.
= 3150/570,
= 5.50.
Vaishali singh said:
5 years ago
Would anyone please elaborate how we got the answer 5.50?
(1)
Vekz said:
9 years ago
Would you please elaborate how we got the answer 5.50?
Post your comments here:
Quick links
Quantitative Aptitude
Verbal (English)
Reasoning
Programming
Interview
Placement Papers