Data Interpretation - Bar Charts - Discussion
Discussion Forum : Bar Charts - Bar Chart 18 (Q.No. 5)
Directions to Solve
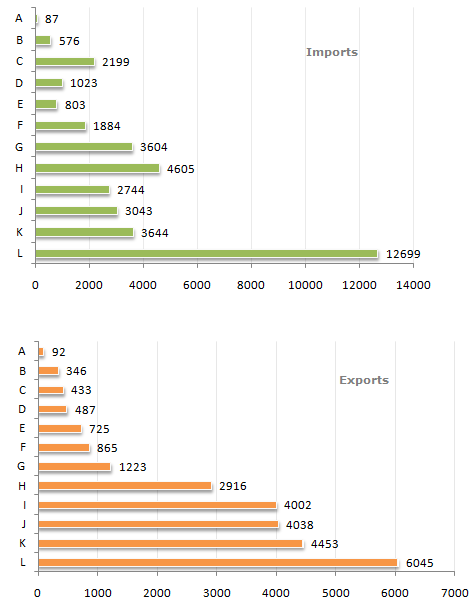
Study the following bar charts and answer the questions.
Foreign Trade (Imports and Exports) by countries for the year (1993 - 1994)
5.
The ratio of Exports to Imports was highest for which country ?
Answer: Option
Explanation:
I has a ratio of 4002/2744 = 1.45, which is the highest.
Discussion:
3 comments Page 1 of 1.
Saurabh joshi said:
3 years ago
When we solve the export of I and import of I, then we get the answer 1.45 and when we solve another ratio then we find the answer is small as compared to I.
(1)
Haalu said:
4 years ago
Anyone explain the answer in detail.
(1)
Mmd basha said:
1 decade ago
Please calculate only for giving option. So sum is very easy.
(2)
Post your comments here:
Quick links
Quantitative Aptitude
Verbal (English)
Reasoning
Programming
Interview
Placement Papers